Understanding how bar construction, update frequency, and price-based chart logic affect technical indicators—and how to develop reliable custom indicators for Renko and Range charts.
Introduction
A custom trading indicator may perform exactly as expected on a 5-minute candlestick chart, yet produce surprisingly different signals when applied to a Tick, Range, or Renko chart.
Moving averages may change direction sooner than expected. Momentum oscillators can reach extreme readings more frequently. Reversal indicators may generate signals at different points, while alerts that worked reliably on time-based charts become inconsistent.
These differences are not necessarily programming errors.
The underlying issue is that time-based and event-based charts organize market data differently. Even when two charts represent the same instrument and trading session, the indicators applied to them may receive substantially different sequences of prices, bars, and calculation events.
For traders using custom indicators for Renko and Range charts, understanding these differences is essential.
A technically correct indicator formula is only one part of the solution. Reliable indicator behavior also depends on how the chart constructs bars, when calculations are updated, and whether signals are generated from developing or completed bars.
This article explains why these differences occur, how they affect trend, momentum, and reversal indicators, and what developers should consider when designing indicators that support multiple chart types.
1. Understanding Time-Based and Event-Based Chart Construction
Traditional technical indicators were largely developed around time-based price series.
A 5-minute chart, for example, creates a new bar every five minutes during the relevant trading session. Each completed bar represents the open, high, low, and close prices over that fixed interval.
Tick, Range, and Renko charts use different rules.
Rather than organizing price data into equal time intervals, these charts build bars according to trading activity or price movement.
That distinction changes the data an indicator processes.
Illustration 1 — How Time-Based, Tick, Range, and Renko charts construct bars
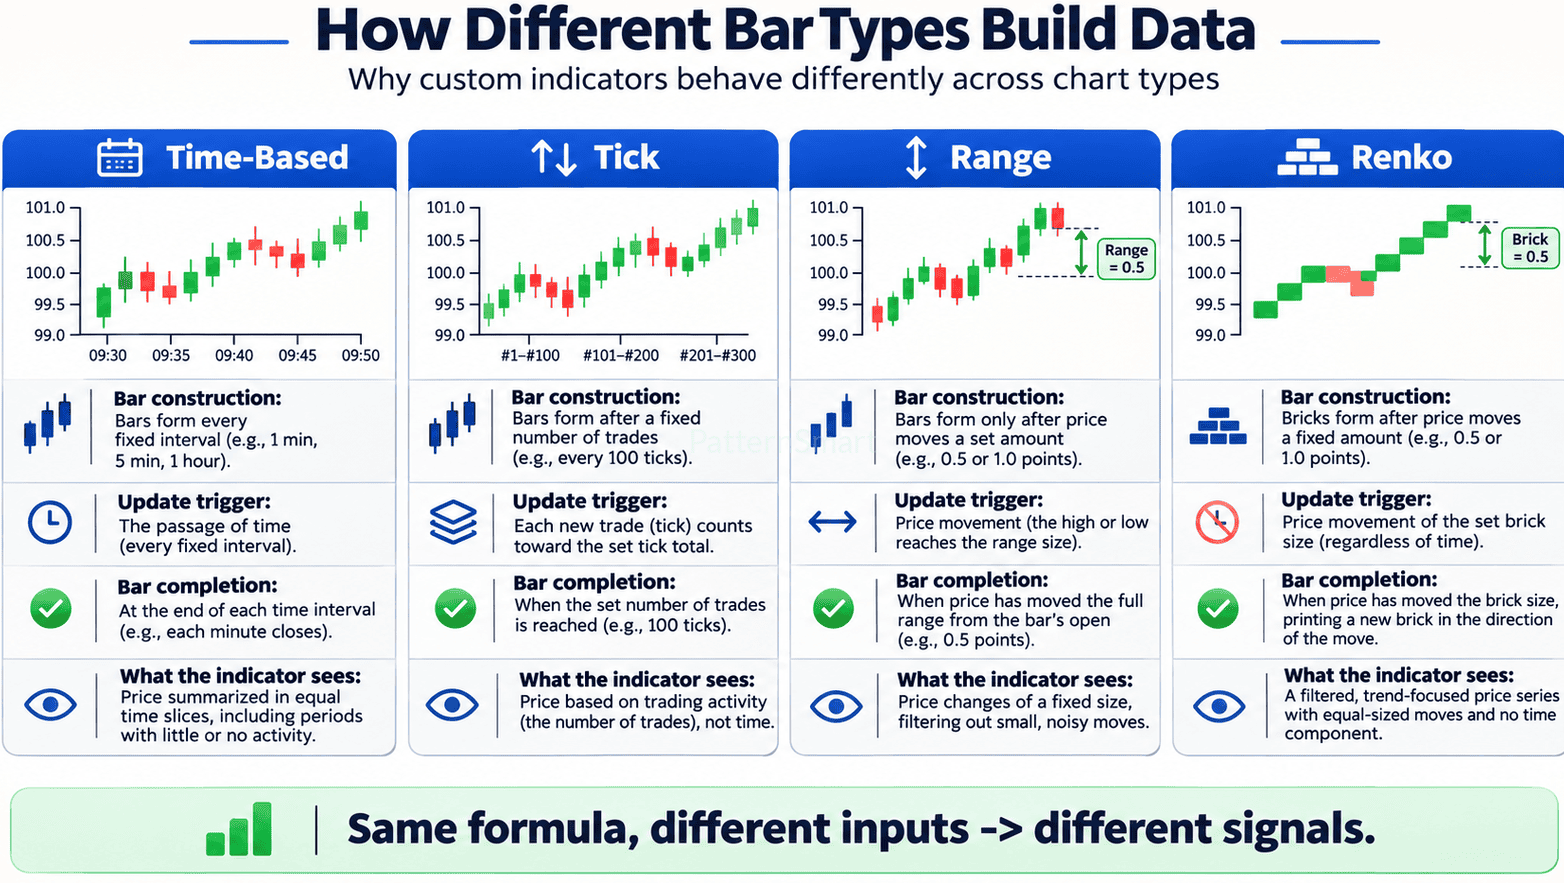
Comparison of time-based, tick, range and Renko chart construction
Time-Based Charts: Fixed Time Intervals
Time-based charts construct bars at predetermined intervals, such as 1 minute, 5 minutes, 15 minutes, or 1 hour.
The primary characteristic is that the duration of each bar is known in advance.
A 20-period moving average on a 5-minute chart uses 20 consecutive bars, representing approximately 100 minutes of scheduled chart time, subject to trading sessions and data availability.
During highly active trading periods, those bars may contain thousands of transactions. During quiet periods, the same number of bars may represent very little market activity.
Nevertheless, the indicator processes each bar as one observation.
This gives time-based indicators a relatively consistent relationship between their lookback periods and elapsed time.
Tick Charts: Bars Based on Trading Activity
Tick charts construct bars after a specified number of ticks or trade events, depending on the platform and data feed.
For example, a 500-tick chart typically creates a new bar after 500 qualifying trade events have been processed.
During an active market session, a 500-tick bar might complete in a few seconds. During a quieter period, completing the same bar could take several minutes.
Consequently, a 20-period moving average on a 500-tick chart does not represent a fixed amount of time.
It represents 20 tick bars, generally corresponding to 10,000 qualifying trade events.
This introduces an important distinction:
A tick-based indicator measures market behavior across trading activity, rather than across a consistent time window.
The definition of a tick also matters. Some feeds aggregate transactions, while different platforms may handle trade records differently. These differences can affect the bars and, ultimately, the indicator outputs.
Range Charts: Bars Based on Price Movement
Range charts construct bars according to a predefined price range.
For example, consider a Range chart configured with a size of 8 ticks on an instrument whose minimum tick size is 0.25 points.
The target bar range is:
\[ 8 \times 0.25 = 2.00\text{ points} \]
Instead of creating a bar after a certain number of minutes or trades, the chart constructs bars as price reaches the platform’s specified range threshold.
This makes Range charts particularly useful for observing price movement independent of a fixed time interval.
However, Range bar implementations vary.
Some platforms construct bars using the entire high-to-low range. Others employ variations involving the bar open, close, gaps, or alternative completion rules.
As a result, two charts both labeled “8 Range” may not produce identical OHLC data.
For custom indicator development, the precise Range bar algorithm must be understood before assuming how the indicator will behave.
Renko Charts: Price-Based Bricks
Renko charts also rely on price movement, but they organize that movement into bricks rather than conventional candlesticks.
A traditional fixed-brick Renko chart may display a new upward brick when price reaches the required upward threshold.
Downward bricks appear when the relevant reversal threshold is satisfied.
The exact rules depend on the Renko implementation, including brick size, price source, reversal requirements, and whether synthetic prices are used.
For example, a Renko chart using a fixed brick size of 1.0 point does not necessarily create a new brick every time price changes by one point from the most recent market price.
The reference price and reversal algorithm determine when a new brick can be constructed.
Some Renko implementations may also modify or replace a previously displayed bar during reversal processing.
This introduces additional challenges for custom indicators, particularly those using historical bar indexes, trend-state transitions, or intrabar signals.
Chart Construction Comparison
| Chart type | Bar construction | Completion condition | Primary characteristic |
|---|---|---|---|
| Time-Based | Fixed time interval | Time interval ends | Consistent chart-time duration |
| Tick | Number of qualifying events | Tick count reached | Activity-driven bars |
| Range | Defined price range | Range rule satisfied | Price-movement-driven bars |
| Renko | Defined brick algorithm | Brick threshold and direction rules satisfied | Filtered price movement |
Although the same indicator formula can be applied to all four chart types, the inputs to that formula may be very different.
That is the foundation of most unexpected indicator behavior.
2. Why the Same Indicator Formula Produces Different Results
A common assumption is that applying the same settings to an indicator should produce approximately the same interpretation across chart types.
For example, a trader might expect a 14-period Relative Strength Index (RSI) to measure the same type of momentum whether it is applied to a 5-minute chart or a Renko chart.
Mathematically, the RSI calculation may remain unchanged.
What changes is the sequence of closing prices being evaluated.
Consider a simplified price series from a time-based chart:
100 → 101 → 100.5 → 101.5 → 101 → 102
A price-filtered chart might represent the same general upward movement as a smaller number of bricks:
100 → 101 → 102
These are illustrative sequences, not the precise output of a particular Renko algorithm.
An RSI calculation using the first sequence processes both upward and downward changes. An RSI using the second sequence encounters only upward changes.
Therefore, the resulting RSI values may be substantially different, even though the underlying instrument experienced the same general price movement.
The indicator has not necessarily malfunctioned.
The chart has changed the price observations available to the indicator.
Four factors explain most of these differences.
Factor 1: Bar Construction Changes the Price Series
Indicators calculate values from a series of observations, usually including open, high, low, close, volume, or derived prices.
When the chart construction method changes, these observations change.
Renko charts often produce more directionally filtered closing-price sequences than conventional candlestick charts.
Range charts constrain bar formation around price-range rules.
Tick charts organize price information around trading activity.
This affects indicators that depend on consecutive price changes, bar highs and lows, or the number of completed observations.
For example, the Average True Range (ATR) calculated from conventional time-based candles measures a different collection of high-low and interbar price movements than ATR calculated from synthetic Renko bricks.
On fixed-brick Renko charts, the brick construction itself can heavily influence the ATR calculation.
An ATR-based stop developed for standard candlesticks therefore should not automatically be assumed to have equivalent volatility behavior on Renko charts.
Factor 2: Update Frequency Is Not Uniform
On a time-based chart, bar-close calculations follow a predictable schedule.
For example, an indicator configured to calculate at the close of each 5-minute bar generally receives one new completed observation every five minutes during the relevant session.
Event-based charts do not follow the same schedule.
A Renko chart might generate several bricks during a rapid price movement, followed by an extended period without a new completed brick.
Similarly, Tick charts may generate bars rapidly during active trading and slowly during low-volume conditions.
There is also an important distinction between incoming market-data updates and completed-bar updates.
An event-based indicator configured for intrabar calculations may update on each qualifying incoming market event, even when no new bar has completed.
An indicator configured for bar-close calculations updates its confirmed output when a bar completes.
These calculation modes can produce very different signal frequencies.
Factor 3: Price Movement Changes the Meaning of a Lookback Period
A 20-period moving average always uses 20 observations under a conventional bar-based implementation.
However, the market meaning of those observations changes.
On a 5-minute chart, 20 bars correspond to approximately 100 minutes of chart time.
On a 500-tick chart, 20 bars represent approximately 10,000 qualifying tick events.
On a fixed-size Renko chart, 20 bricks represent 20 completed price-filtering events, not a fixed time duration or necessarily 20 points of net movement.
That last distinction is especially important.
Twenty one-point Renko bricks do not automatically represent a 20-point directional trend. Some of those bricks may be upward and others downward.
An indicator using a bar-based lookback therefore measures different dimensions of market behavior on different chart types.
Factor 4: Bar Completion Determines Signal Confirmation
The current, developing bar is often the most important source of unexpected signals.
Consider a custom reversal indicator that generates a buy signal when the current close crosses above a moving average.
On a time-based chart, the current candle may temporarily cross above the moving average before returning below it.
If the indicator is calculated intrabar, the buy signal may appear and then disappear before the candle closes.
A similar issue can occur on Range and Renko charts.
A developing Range bar may reach a temporary price level without satisfying the final bar-completion condition.
A developing Renko brick may be displayed before the relevant price movement is confirmed. Depending on the platform and bar implementation, that provisional brick may later change or disappear.
If an indicator treats developing bars as confirmed observations, it may produce signals that cannot be reconstructed reliably from historical completed bars.
This is why bar completion is a fundamental design consideration—not simply a display preference.
3. How Event-Based Charts Affect Trend, Momentum, and Reversal Indicators
How bar construction affects trend, momentum, and reversal indicators
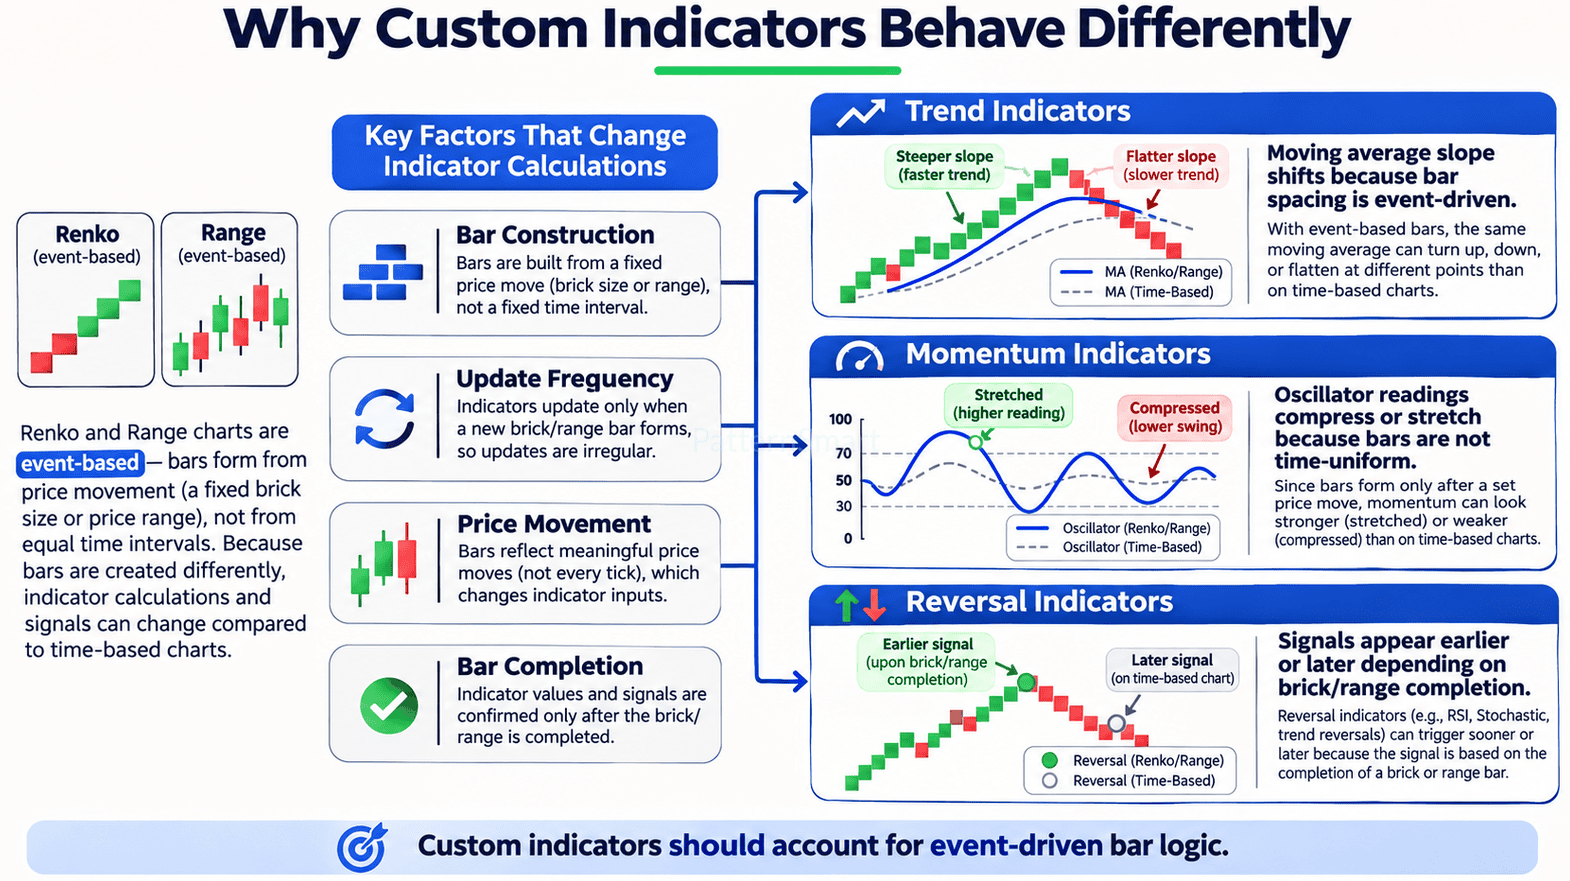
Illustration 2 — Four underlying factors influencing three major indicator categories. Conceptual examples, not measured trading results.
3.1 Trend Indicators: Moving Averages and Trend Filters
Moving averages are among the most widely used trend indicators.
A conventional exponential moving average (EMA) is calculated using:
\[ EMA_t = \alpha P_t + (1-\alpha)EMA_{t-1} \]
where:
\[ \alpha = \frac{2}{N+1} \]
Here, \(P_t\) represents the selected price observation and \(N\) represents the EMA period.
The mathematical formula does not inherently require time-based bars.
However, the formula assumes that each new observation advances the calculation by one step.
That assumption has practical consequences.
Example: A 20-period EMA on a Renko chart
Suppose a trader develops a trend-following indicator using a 20-period EMA on a 5-minute chart.
The indicator changes its trend state when price closes above or below the EMA, subject to an additional confirmation rule.
When this indicator is moved to a fixed-brick Renko chart, the EMA receives a different closing-price sequence.
During a strong upward price movement, several consecutive upward bricks may form.
Each completed brick advances the EMA calculation.
The EMA may respond differently to the price trend because its observations reflect price-driven events rather than evenly spaced time periods.
If an indicator also calculates EMA slope as the difference between current and previous EMA values, the interpretation changes further.
The difference between two successive EMA values represents movement per bar—not necessarily movement per minute.
A steep EMA slope on a Renko chart therefore should not be interpreted as directly equivalent to the same numerical slope on a 5-minute chart.
How to adapt the indicator
A custom trend indicator can support multiple chart types by separating its trend calculation from its time-related assumptions.
A developer might implement two alternative slope measurements:
- Bar-based slope: EMA change per completed bar, appropriate when the trader wants event-based trend behavior.
- Time-normalized slope: EMA change divided by elapsed time, appropriate when trend speed per unit of time matters.
A third approach is to calculate the EMA from an independent time-based data series while displaying trend signals on the Renko chart.
For example, the indicator might use a 5-minute EMA as its trend filter and use Renko bricks for entry timing.
That approach preserves the intended time-based trend measurement while retaining the Renko chart as a price-action display.
However, it introduces multi-series synchronization requirements, particularly when historical data and live updates are processed differently.
3.2 Momentum Indicators: RSI, Stochastic, and Rate of Change
Momentum indicators measure the strength, direction, or relative magnitude of price changes.
Their calculations are particularly sensitive to how price observations are grouped.
Consider RSI.
A conventional RSI compares smoothed average gains and losses over a specified number of periods.
On a time-based chart, these gains and losses reflect price changes between consecutive time bars.
On a Renko chart, they reflect changes between consecutive brick closes.
Because Renko charts often filter smaller price movements, a sequence of upward bricks may cause RSI to remain elevated for an extended number of bricks.
For example, an RSI reading above 70 on a time-based chart might be interpreted as relatively strong recent upward momentum.
On a Renko chart, an elevated RSI can reflect a sequence dominated by completed upward bricks.
It does not necessarily imply that price has risen unusually quickly in clock time.
This distinction matters when traders use RSI thresholds as entry or exit signals.
Example: A momentum indicator on a Range chart
Imagine a trader uses a 14-period Rate of Change (ROC) indicator to identify momentum acceleration.
A simplified ROC formula is:
\[ ROC = \frac{P_t-P_{t-N}}{P_{t-N}}\times100 \]
On a 5-minute chart, a 14-period ROC measures price change across approximately 70 minutes of chart time.
On an 8-tick Range chart, it measures price change across 14 completed Range bars.
During high volatility, those 14 bars may complete quickly.
During quieter conditions, the same number of bars might take considerably longer.
Therefore, the ROC value may still describe a meaningful price change, but it does not describe a consistent rate of change per minute.
How to adapt momentum indicators
The best approach depends on the intended trading logic.
If the trader wants to measure momentum across a number of price events, using Range or Renko bar closes may be appropriate.
If the goal is to measure momentum over a fixed elapsed interval, the indicator should use time-based observations or explicitly incorporate elapsed time.
For example, a custom momentum indicator might provide two calculation modes:
Event-Based Momentum
Measures price change across a defined number of completed Tick, Range, or Renko bars.
Time-Normalized Momentum
Measures price change or a derived return across a defined elapsed-time interval, using appropriately timestamped market data.
These modes should not be treated as interchangeable.
They answer different questions about market behavior.
3.3 Reversal Indicators: Signal Timing and Confirmation
Reversal indicators introduce additional complexity because their signals often depend on conditions developing near the end of a price movement.
A common reversal system might require:
- A prevailing trend.
- Evidence of momentum weakening.
- A price-based reversal condition.
- A confirmed signal after the relevant bar closes.
On time-based charts, confirmation may occur at the end of a fixed interval.
On Renko charts, confirmation depends on price movement satisfying the relevant brick construction and reversal rules.
This means the same market reversal can be recognized at different points by the two systems.
Neither must always be earlier.
A Renko reversal may be confirmed quickly during volatile trading, or it may require additional price movement beyond the point where a time-based indicator has already identified a change.
Example: A custom Renko trend-reversal indicator
Suppose an indicator tracks an established upward Renko trend and generates a bearish reversal signal when:
- A downward reversal brick has been confirmed.
- A momentum filter indicates weakening upward momentum.
- The price has crossed a predefined trailing trend level.
An intrabar version might display an early warning when a downward brick begins forming.
However, that warning is provisional.
If price reverses before the brick is finalized, the warning may disappear.
A completed-bar version waits until the brick is confirmed and then evaluates the remaining reversal conditions.
The second version may signal later but provides a clearer historical record of confirmed signals.
For developers, a useful design is to distinguish three separate states:
| Signal state | Meaning | Intended use |
|---|---|---|
| Developing | Conditions currently appear satisfied | Early visual warning |
| Confirmed | Conditions satisfied on a completed bar | Stable signal record |
| Invalidated | Developing conditions no longer hold | Remove provisional warning |
This separation helps traders understand whether a signal is actionable under their strategy rules and reduces confusion about apparent repainting.
4. Why Indicators Appear to Repaint on Renko and Range Charts
Repainting is one of the most frequently discussed problems associated with custom indicators on event-based charts.
However, not every changing signal is evidence of faulty programming.
Several different behaviors are often grouped under the term “repainting.”
Intrabar Changes
An indicator may update as new market information arrives.
If a signal condition becomes true temporarily and then becomes false before the bar closes, the signal may appear and disappear.
This can occur on conventional candlesticks as well as event-based charts.
The solution depends on whether the intended indicator is designed for early intrabar warnings or confirmed bar-close signals.
Developing Renko Bricks
Certain Renko implementations display developing bricks before they satisfy their final completion conditions.
The appearance of these bricks may change as prices fluctuate.
If an indicator uses the latest developing brick as a completed observation, its signals may not remain stable.
The indicator should explicitly distinguish between provisional and confirmed data.
Historical Bar Reconstruction
Some chart construction algorithms do not process historical and real-time market data identically.
This can become particularly problematic with certain Renko implementations that modify the most recent bar during reversal processing.
An indicator may appear consistent when reviewed on historical charts but behave differently during live trading.
There may also be differences when the platform reloads the chart or rebuilds bars from the available tick history.
Consequently, comparing historical screenshots with live signals is not sufficient to establish that an indicator is reliable.
Multi-Brick Events
A sudden market movement may cross several price thresholds in a short period.
Depending on the platform, multiple bricks may be created from a single update or a rapid sequence of updates.
An indicator that assumes only one new bar can appear per calculation event may fail to process every transition correctly.
For example, a custom trailing stop that updates its internal state by one brick at a time could calculate incorrectly if it does not handle multiple newly completed bricks.
A robust implementation should handle the actual bar sequence exposed by the platform, including any supported historical revisions.
The objective is not necessarily to prevent all indicator values from changing. It is to make the calculation state, confirmation rules, and historical behavior predictable and transparent.
5. Practical Example: One Trading Strategy Across Three Event-Based Charts
Consider a hypothetical trading strategy with the following components:
- A 20-period EMA to identify the prevailing trend.
- A 14-period RSI to evaluate momentum.
- A price-based trailing stop to identify possible reversals.
The strategy generates a long signal when price is above the EMA, the RSI satisfies the selected momentum condition, and a predefined entry trigger is confirmed.
The same formula is then applied to three chart types.
Scenario A: 500-Tick Chart
On the 500-tick chart, bars are generated according to trading activity.
During active trading periods, the EMA and RSI receive new completed observations frequently.
During low-activity periods, their confirmed values update less frequently.
This approach may be useful for traders who want indicator updates to follow market participation.
However, the indicator’s lookback represents trading events rather than elapsed time.
A custom implementation should pay particular attention to trade aggregation, session boundaries, and the availability of accurate historical tick data.
Scenario B: 8-Tick Range Chart
On an 8-tick Range chart, bar construction is driven by price movement.
The EMA responds to a sequence of Range-bar closes.
The RSI evaluates gains and losses between those closes.
The trailing stop may also behave differently because its calculation receives a different sequence of highs, lows, and closes than it would on a time-based chart.
Price may oscillate inside the developing Range bar without creating a new completed observation.
This can make confirmed signals appear less frequently in quiet conditions, while fast price movement can produce rapid sequences of completed bars.
The precise result depends on the Range bar implementation and the indicator’s intrabar settings.
Scenario C: Fixed-Brick Renko Chart
On a fixed-brick Renko chart, the indicator receives brick-based observations.
During a strong directional move, a sequence of same-direction bricks may cause the EMA and RSI to reflect sustained directional movement.
When price reverses, the indicator must account for the Renko reversal threshold and any platform-specific bar modifications.
A trailing stop calculated from synthetic brick highs and lows may also differ substantially from one calculated from actual traded prices.
For a strategy that submits live orders, this distinction can be critical.
Renko prices displayed on a chart are not always equivalent to prices at which an order could have been executed.
Comparison of Strategy Behavior
| Indicator component | Tick chart | Range chart | Renko chart |
|---|---|---|---|
| 20-period EMA | Smooths activity-based observations | Smooths range-based closes | Smooths brick-based closes |
| 14-period RSI | Momentum across tick bars | Momentum across Range bars | Momentum across brick closes |
| Trailing stop | Responds to tick-bar prices | Responds to Range-bar OHLC | May depend on synthetic brick prices |
| Confirmation timing | Tick-count completion | Range completion | Brick/reversal completion |
| Main development concern | Tick data consistency | Range algorithm and bar state | Synthetic prices and brick reconstruction |
This comparison demonstrates why copying the same parameters across chart types is not necessarily a meaningful test.
A better approach is to define what each indicator component is intended to measure and then determine which data representation best supports that purpose.
6. How to Develop Custom Indicators That Support Multiple Bar Types
Adaptation checklist for trend, momentum, and reversal indicators
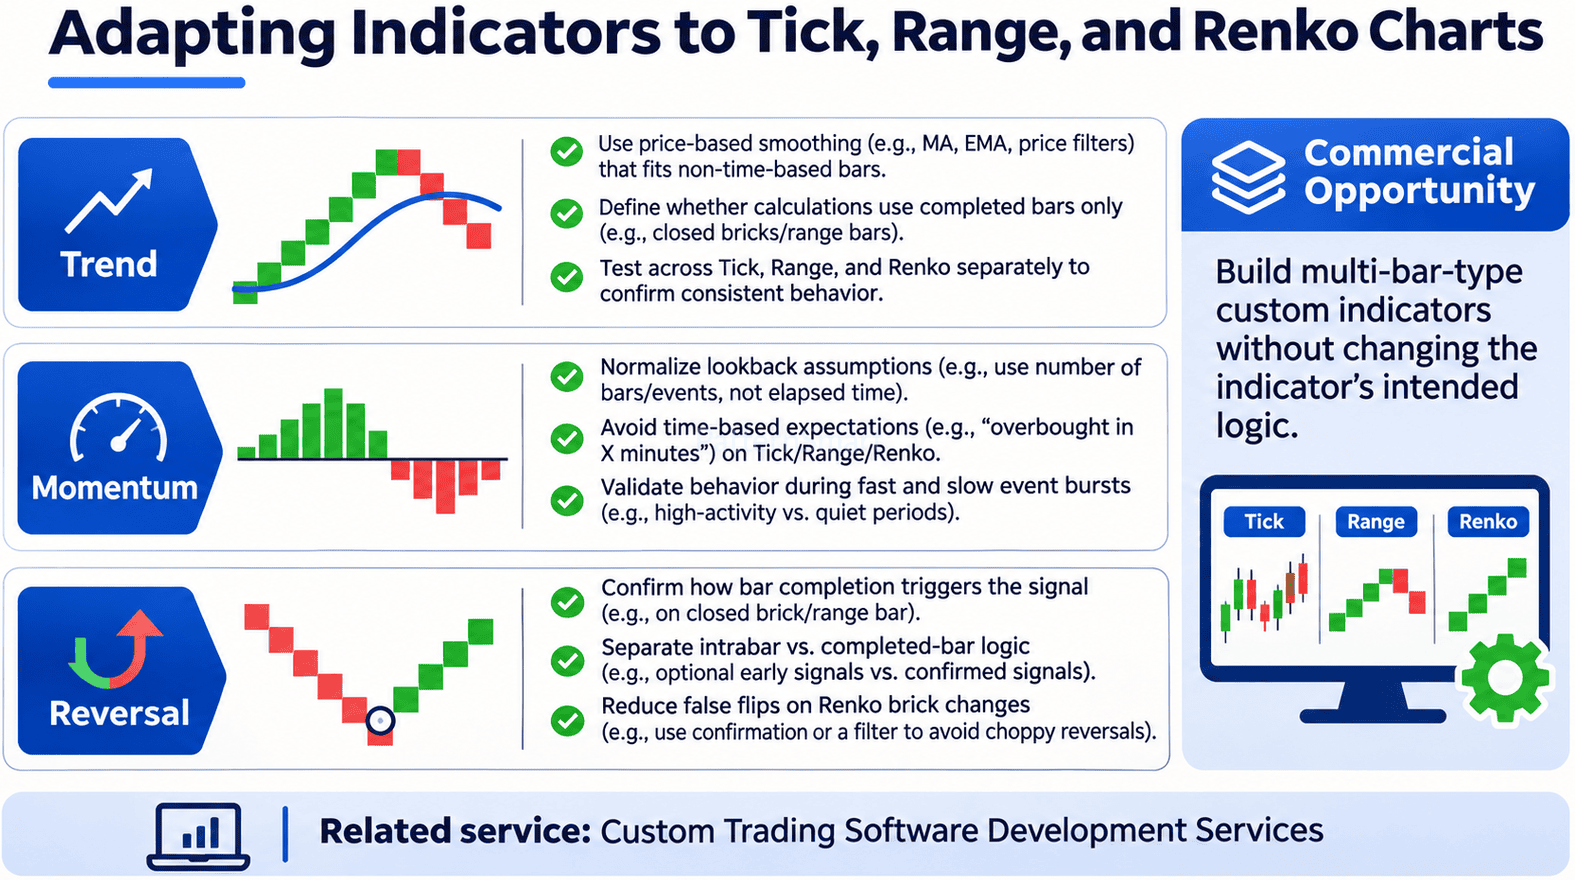
Illustration 3 — Practical development considerations for multi-bar-type indicators.
Developing custom indicators for Renko and Range charts requires more than ensuring that the indicator compiles and displays correctly.
The indicator should preserve its intended analytical meaning while adapting to different bar construction rules.
The following design principles are particularly important.
6.1 Separate Indicator Logic From Chart Construction
A reusable indicator should not unnecessarily assume that each bar represents a fixed interval of time.
For example, consider a trend indicator that calculates:
TrendStrength = EMA[0] - EMA[5]
This measures EMA change across five bar intervals.
It does not inherently measure trend strength over a fixed number of minutes.
If the developer intends to measure price movement per unit of time, elapsed time must be incorporated into the calculation.
Alternatively, the indicator can retain its event-based interpretation and explicitly describe its output as a measure across five completed bars.
Both approaches can be valid.
The key is avoiding an unintended change in meaning when switching chart types.
6.2 Support Multiple Calculation Modes
A multi-bar-type indicator may benefit from configurable calculation modes, such as:
Bar-Based Mode: Uses the chart’s native completed bars for calculations. This allows the indicator to adapt directly to Tick, Range, or Renko price sequences.
Time-Based Reference Mode: Calculates indicators from a separate time-based series while displaying the results or signals on the event-based chart.
Price-Event Mode: Processes defined price movement events, potentially using a dedicated event-detection algorithm instead of relying exclusively on the displayed chart bars.
Tick-Level Mode: Uses actual incoming tick or trade data when the calculation requires finer granularity than completed bars provide.
These modes should be implemented only when appropriate for the indicator’s analytical purpose.
Adding more options does not automatically produce a better indicator. Each mode introduces additional calculation, synchronization, and testing requirements.
6.3 Handle Developing and Completed Bars Separately
An indicator should define exactly when its output becomes final.
For example, a reversal indicator could provide:
ShowEarlyWarning = true
ConfirmOnBarClose = true
With these options, the indicator can display a provisional signal while the current bar develops and preserve a separate confirmed signal once the relevant completion conditions are satisfied.
Internally, the developer should avoid storing provisional values as permanent historical signals.
This is especially important for indicators that generate alerts, trigger automated strategies, or export signals to other systems.
6.4 Handle Irregular Bar Updates
Event-based charts may generate completed bars at irregular intervals.
A well-designed indicator should not assume that one bar is completed for every market-data callback.
It should also avoid assuming that every callback creates a new bar.
A conceptual calculation workflow might be:
OnMarketUpdate():

    UpdateCurrentMarketState()

    ProcessAnyNewlyCompletedBars()

    if CurrentBarIsDeveloping:
        UpdateProvisionalValues()

    if NewConfirmedSignal:
        RecordSignal()
        SendConfirmedAlert()

    UpdateChartDisplay()
This is conceptual pseudocode rather than platform-specific implementation.
The exact approach depends on how the trading platform exposes bar completion, historical recalculation, and market-data events.
For Renko implementations that can revise or replace recent bars, additional state-reconciliation logic may be required.
6.5 Consider Session Boundaries and Data Gaps
Session boundaries can affect how event-based bars are constructed.
Some platforms reset or terminate developing bars at session changes. Others offer configurable behavior.
Similarly, overnight gaps and missing tick records can change the reconstructed bar sequence.
These differences can affect indicators that rely on previous bar closes, consecutive highs and lows, or session-based reference levels.
For example, a custom trend indicator that carries state across sessions may produce different signals from one that resets at the beginning of each trading session.
Neither behavior is universally correct.
The appropriate choice depends on the intended trading methodology.
Developers should therefore document session-handling rules and test them explicitly.
7. Testing Custom Indicators on Tick, Range, and Renko Charts
Testing event-based indicators requires special attention because historical bars may not provide a complete representation of how signals developed in real time.
A reliable testing process should evaluate both mathematical calculations and real-time behavior.
Historical Calculation Testing
The first step is to verify that the indicator calculates correctly using the historical data supplied by the platform.
This includes checking moving average formulas, oscillator values, state changes, and signal conditions.
Historical testing is useful for validating the indicator’s mathematical logic.
However, it cannot always reproduce the precise sequence of developing bars and provisional signals observed during live trading.
Real-Time or Tick Replay Testing
Where supported, tick replay or a comparable playback environment can help developers inspect how calculations evolve as market events arrive.
The developer can evaluate whether:
- Provisional signals appear and disappear as intended.
- Confirmed signals are recorded only when their conditions are satisfied.
- Multiple completed bars are processed correctly.
- Chart reloads produce consistent confirmed historical outputs, subject to the platform’s reconstruction rules.
For some Renko implementations, replay testing is particularly valuable because conventional historical strategy processing may not accurately reproduce live reversal-bar behavior.
Data Quality Testing
Tick, Range, and Renko charts can be sensitive to data-feed differences.
Missing trade records, aggregation rules, historical data resolution, and session templates can alter the constructed bars.
When comparing indicator outputs between platforms, developers should verify that the underlying data and bar settings are actually comparable.
Otherwise, differences may be incorrectly attributed to the indicator code.
Execution and Backtesting Validation
A critical distinction exists between indicator signals and executable trade prices.
For example, an indicator may correctly identify a reversal on a Renko brick.
However, the brick’s displayed open or close may be synthetic and may not correspond to an actual executable market price.
If an automated strategy assumes an order was filled at that synthetic price, the resulting backtest may overstate performance.
For execution testing, it is generally preferable to evaluate orders against actual market-price data at a suitable resolution, with appropriate assumptions for spread, slippage, commissions, and order type.
The signal calculation and execution model should be validated separately.
Recommended Test Matrix
| Test | Time-Based | Tick | Range | Renko |
|---|---|---|---|---|
| Historical formula verification | Yes | Yes | Yes | Yes |
| Developing-bar signal testing | Yes | Yes | Yes | Yes |
| Confirmed-bar signal testing | Yes | Yes | Yes | Yes |
| Session and gap handling | Yes | Yes | Yes | Yes |
| Tick data and aggregation validation | As applicable | Essential | Important | Important |
| Bar reconstruction testing | Useful | Important | Important | Essential |
| Live execution-price validation | Essential for trading systems | Essential | Essential | Essential |
A custom indicator should be evaluated on each chart type it claims to support.
Successful operation on a 5-minute chart does not establish that its behavior will remain appropriate on an event-based chart.
8. Platform-Specific Considerations for Custom Indicator Development
Different trading platforms provide different APIs, chart-building algorithms, and methods for processing market-data updates.
This can affect how custom indicators should be implemented.
NinjaTrader
NinjaTrader supports custom indicator development using NinjaScript and provides calculation settings and data-series mechanisms that developers can use to manage different update behaviors.
For event-based charts, particular attention should be given to bar-completion handling, multi-series calculations, and custom BarsType behavior.
Certain standard Renko processing behaviors can also create differences between historical strategy testing and real-time operation.
A reliable custom indicator should account for the relevant platform behavior rather than assuming that historical bars always represent immutable observations.
Sierra Chart
Sierra Chart supports custom studies and offers multiple Range and Renko bar configurations.
Developers using ACSIL or other supported study mechanisms should pay close attention to the specific chart settings and underlying data resolution.
For example, different Range bar implementations may handle OHLC values, price gaps, and bar construction differently.
Consequently, an indicator intended for one Range bar type should be tested before it is presented as compatible with every Range bar variation.
MultiCharts
MultiCharts provides indicator and strategy development through PowerLanguage and, in supported editions, .NET development capabilities.
When developing multi-data-series indicators or applying calculations to alternative chart types, developers should verify calculation timing, series synchronization, and historical versus real-time behavior.
The relevant implementation depends on the selected chart type, platform edition, and available data resolution.
TradingView
TradingView supports custom indicators through Pine Script and provides access to various non-standard chart representations.
However, synthetic chart prices create important limitations for strategy backtesting and execution assumptions.
Developers should distinguish between generating an analytical signal from a non-standard chart and evaluating whether an order could have been executed at a displayed chart price.
These are separate technical problems.
Across platforms, the underlying development principle remains consistent:
A portable indicator should preserve the intended calculation logic, not simply reproduce the same source code on every chart type.
9. When Custom Indicator Development Becomes Necessary
Built-in indicators are often sufficient for standard chart analysis.
However, traders may encounter limitations when their strategies require precise signal behavior across multiple chart types.
For example, a trader might need an indicator that:
- Uses a time-based moving average as a trend filter while generating entries on a Renko chart.
- Calculates momentum from completed Range bars without allowing developing bars to modify confirmed signals.
- Displays early reversal warnings separately from confirmed entry signals.
- Maintains consistent signal records when a chart is reloaded or recalculated.
- Supports Tick, Range, Renko, and conventional candlestick charts through clearly defined calculation modes.
- Generates alerts or strategy outputs based on explicit bar-completion and data-source rules.
These requirements may be difficult to satisfy with a standard indicator that simply applies the same formula to the currently displayed chart.
A custom implementation provides an opportunity to define the calculation behavior precisely.
For example, a custom trend system could use three separate components:
Trend Direction: Calculated from a conventional time-based data series.
Entry Timing: Evaluated using completed Renko bricks or Range bars.
Risk Management: Based on actual market-price data rather than relying exclusively on synthetic brick values.
This architecture allows each component to use the data representation most appropriate for its purpose.
It also makes the indicator’s behavior more transparent and easier to test.
The goal is not to force identical signals across different chart types.
Instead, it is to ensure that the indicator continues to measure what it was designed to measure.
10. Developing Reliable Multi-Bar-Type Indicators With PatternSmart
For traders who rely on custom technical indicators, unexpected behavior on Tick, Range, or Renko charts can create uncertainty around signal timing, historical accuracy, and strategy execution.
Resolving these problems often requires examining both the indicator formula and the underlying chart construction process.
At PatternSmart, custom trading software development can address requirements such as platform-specific indicator logic, multiple data-series calculations, bar-completion handling, and signal visualization.
A development project may involve adapting an existing indicator to event-based charts or designing a new indicator around specific trading requirements.
Potential development areas include:
- Custom trend, momentum, and reversal indicators.
- Renko- and Range-aware signal calculations.
- Multi-timeframe and multi-data-series indicators.
- Confirmed versus developing signal management.
- Customized alerts and chart visualization.
- Platform-specific indicator implementation and testing.
- Integration of indicator outputs with broader trading systems.
For traders seeking custom indicators for Renko and Range charts, a well-defined development specification should establish the calculation source, chart construction assumptions, update rules, and expected signal behavior before implementation begins.
These decisions help reduce ambiguity and provide a clearer basis for testing the finished indicator.
To explore custom indicator development and trading software solutions, visit PatternSmart’s Custom Trading Software Development Services.
11. Frequently Asked Questions
Why does my indicator work on a candlestick chart but not on a Renko chart?
The indicator may be receiving a different sequence of price observations on the Renko chart.
Renko bricks are constructed using price-movement rules rather than fixed time intervals. This changes the input data for moving averages, oscillators, and other indicators.
Some implementations also modify developing or recent bars, which can affect signal confirmation.
The indicator may need changes to its calculation source, bar-completion handling, or historical state management.
Do custom indicators repaint on Renko charts?
Some indicators may display changing signals on developing Renko bricks.
This is not always a programming defect. It can result from provisional bar construction or intrabar calculation settings.
However, an indicator that is intended to produce stable confirmed signals should clearly separate developing conditions from completed-bar confirmations.
Certain Renko implementations also require special handling when recent bars are reconstructed or replaced.
Can RSI be used on Range and Renko charts?
Yes. RSI can be calculated from Range or Renko closing prices.
However, its interpretation changes because the observations are organized by price events rather than fixed time intervals.
An RSI reading on a Renko chart may reflect a sustained sequence of directional bricks, rather than price movement over a particular number of minutes.
Traders should test whether their chosen RSI settings and thresholds remain appropriate for the selected chart type.
Why does a moving average look different on a Tick chart?
Tick charts create bars based on trading events rather than elapsed time.
A 20-period moving average therefore represents 20 tick bars, not a fixed time interval.
During active trading, those bars may form quickly. During quieter periods, they may take much longer.
The moving average also receives a different sequence of closing prices compared with a time-based chart.
Are Renko and Range charts better for identifying trends?
They can make certain types of directional price movement easier to observe by organizing bars around price thresholds.
However, they do not guarantee better signals or more profitable strategies.
Filtering price movement may also delay the recognition of certain changes or obscure information about elapsed time.
Their usefulness depends on the trader’s objectives, chart settings, and indicator design.
Can one custom indicator support Tick, Range, Renko, and time-based charts?
Yes, provided the trading platform supports the required data access and calculation mechanisms.
However, supporting multiple chart types should involve more than displaying the same formula on each chart.
A robust implementation may need configurable calculation sources, different confirmation rules, or specialized handling for synthetic bars.
The objective should be to preserve the indicator’s intended behavior while accommodating differences in chart construction.
Why do my Renko backtest results differ from live trading?
Differences may arise from synthetic brick prices, historical reconstruction, developing-bar behavior, data resolution, or order-fill assumptions.
A strategy backtest that assumes orders execute at displayed Renko prices may produce results that are not achievable in live markets.
Tick-level playback and execution testing against actual market-price data can help identify these discrepancies.
Conclusion: Reliable Indicators Start With the Right Data Model
Tick, Range, and Renko charts provide alternative ways to visualize market behavior.
They can help traders focus on trading activity, price movement, and directional structure rather than relying exclusively on fixed time intervals.
However, these advantages also change the data that technical indicators process.
A moving average on a Renko chart is not necessarily measuring the same market behavior as the identical moving average on a 5-minute chart.
An RSI calculated from Range bars does not represent the same observation window as an RSI calculated from conventional time-based candles.
A reversal signal generated from a developing Renko brick is not equivalent to one confirmed after a completed bar.
Understanding these differences is essential when building reliable custom indicators for Renko and Range charts.
Effective indicator development begins by answering four questions:
- What market behavior is the indicator intended to measure?
- Which price observations and chart construction rules should it use?
- When should its calculations and signals become final?
- How will its historical and real-time behavior be validated?
When these questions are addressed, traders can use event-based charts without unintentionally changing the analytical purpose of their indicators.
For customized implementations, PatternSmart’s Custom Trading Software Development Services can provide a starting point for discussing indicator requirements, chart compatibility, and platform-specific development.