Automatically Identify Bullish and Bearish Pennant Patterns on TradingView
Chart Pattern Pennant for TradingView is a specialized technical analysis indicator designed to automatically identify bullish and bearish pennant patterns directly on your price chart.
Instead of manually searching through swing highs and swing lows, drawing converging trendlines, and deciding whether a developing structure qualifies as a pennant, the indicator continuously analyzes price structure and highlights qualifying formations automatically.
Chart Pattern Pennant provides a clean visual framework for studying pennant formations across multiple pattern sizes while giving traders control over which patterns are displayed, how the lines look, and how far the detected formation is extended.
With optional alerts and breakout monitoring for bearish pennant structures, the indicator can become a practical addition to a broader price-action and chart-pattern analysis workflow.
What Is a Pennant Pattern?
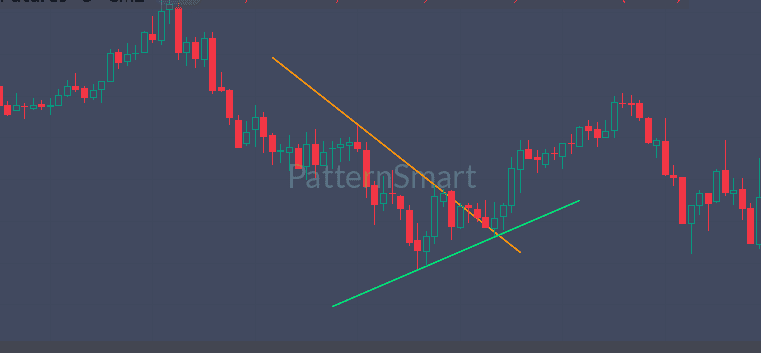
A pennant is a chart formation characterized by a period of price consolidation in which the upper and lower boundaries converge.
Unlike a conventional parallel price channel, a pennant typically develops as price moves between converging resistance and support boundaries.
Chart Pattern Pennant is designed to identify these structured formations and display the corresponding boundaries directly on the TradingView chart.
The indicator supports both:
- Bullish Pennant
- Bearish Pennant
This allows traders to study pennant formations in both upward- and downward-oriented market environments.
The indicator is intended as a pattern-recognition and visualization tool. It does not replace broader market analysis or risk management.
Key Features
Automatic Bullish Pennant Detection
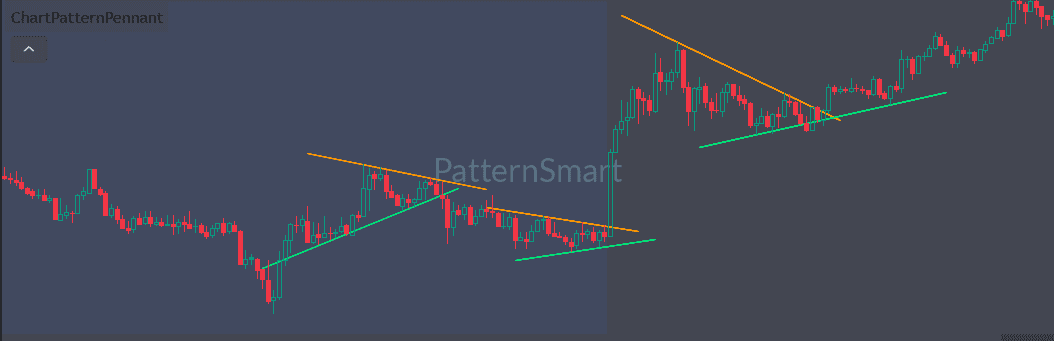
Chart Pattern Pennant can automatically identify qualifying bullish pennant formations and draw their upper and lower boundaries on the price chart.
The indicator evaluates the underlying price structure and looks for a converging formation that meets its internal pattern requirements.
When a qualifying bullish pennant is detected, the formation is displayed directly over price.
This can help traders quickly locate potential consolidation structures without manually drawing and evaluating every possible pair of trendlines.
Automatic Bearish Pennant Detection
The indicator also supports bearish pennant formations.
A bearish pennant represents a downward-oriented consolidation structure in which price develops between converging boundaries.
Chart Pattern Pennant automatically evaluates the chart for qualifying bearish structures and displays them using the same visual framework.
Bullish and bearish detection can be controlled independently, allowing traders to focus on one direction or monitor both.
Multiple Pattern Sizes
Chart Pattern Pennant supports three pattern-size categories:
- Small Pattern
- Medium Pattern
- Large Pattern
Each size can be enabled or disabled independently.
This provides flexibility for traders who want to focus on different structural scales.
For example, a trader interested in shorter-term formations can concentrate on smaller patterns, while traders analyzing broader market structures can enable medium or large formations.
You can also enable all three categories to allow the indicator to search across multiple structural scales.
Visual Pennant Boundaries
When a qualifying pattern is identified, Chart Pattern Pennant draws two converging lines representing the upper and lower boundaries of the formation.
These lines provide an immediate visual representation of the pennant structure.
Instead of having to manually identify the relevant swing points and connect them with trendlines, traders can see the detected formation directly on the chart.
This makes it easier to study:
- Converging price structure
- Consolidation areas
- Upper and lower boundaries
- Potential continuation areas
- Historical pennant formations
- Developing price action around detected patterns
Adjustable Pattern Extension
Chart Pattern Pennant includes an Extension Bars setting that controls how far the detected pattern boundaries extend forward.
This creates additional chart space for observing how price behaves relative to the projected boundaries.
Extended lines can be useful when monitoring a developing formation because the visual structure remains available beyond the historical points used to identify the pattern.
The extension setting can be adjusted according to your preferred chart layout and analysis style.
Show Only the Latest Pattern
For traders who prefer a cleaner chart, Chart Pattern Pennant includes a Show Last Pattern Only option.
When enabled, the indicator removes previously displayed pennant lines when a new pattern is drawn.
This creates a more focused chart showing the latest relevant formation rather than leaving numerous historical structures on the screen.
When disabled, detected formations can remain available for historical chart analysis.
This makes the indicator suitable for both:
- Live chart monitoring
- Historical pattern study
Customizable Line Styles
Chart Pattern Pennant gives traders control over the appearance of the detected pattern boundaries.
You can choose from three line styles:
- Solid
- Dashed
- Dotted
The line width can also be adjusted.
This allows the indicator to fit naturally into different TradingView chart layouts without forcing a single visual presentation.
Custom Pattern Colors
The upper and lower pennant boundaries can be customized independently.
Available visual settings include:
- Upper Line Color
- Lower Line Color
- Breakout Cross Color
This makes it possible to create a visual configuration that works with your existing chart theme and other indicators.
The separate upper and lower colors also make the converging structure easier to distinguish visually.
Optional Pattern Alerts
Chart Pattern Pennant includes an optional alert function for newly detected pennant patterns.
When enabled, TradingView can generate an alert when the indicator identifies a qualifying:
- Bullish Pennant
- Bearish Pennant
This can help traders monitor multiple markets without constantly watching every chart.
Alerts can be particularly useful for traders who use pennants as one component of a broader market-scanning workflow.
Bearish Pennant Breakout Monitoring
In addition to identifying bearish pennant formations, the indicator includes dedicated monitoring for a bearish lower-boundary breakout.
When the relevant bearish pennant structure is detected, the indicator can monitor subsequent price action for a qualifying break below the lower boundary.
When such a breakout is detected, a separate visual breakout marker can be displayed on the chart.
An optional alert can also be generated for the bearish pennant lower-line breakout.
This gives the indicator an additional layer of post-pattern monitoring rather than simply drawing the formation and stopping there.
Visual Breakout Marker
Chart Pattern Pennant can display a distinct breakout marker when the monitored bearish pennant lower boundary is broken according to the indicator’s detection conditions.
The breakout marker has its own customizable color setting.
This makes it visually different from the original pennant detection and helps separate:
Pattern Detection → Subsequent Breakout Event
from the underlying formation itself.
How Chart Pattern Pennant Fits Into Technical Analysis
Pennants are generally studied as periods of consolidation within a directional market structure.
Rather than treating a detected pennant as an automatic trading signal, traders can use the formation as additional context for evaluating price behavior.
For example, a trader may combine pennant analysis with:
- Market trend analysis
- Support and resistance
- Volume
- Price action
- Momentum indicators
- Moving averages
- Higher-timeframe structure
- Breakout confirmation
- Risk management
The detected pattern provides a structural reference point that can be evaluated alongside these other forms of analysis.
Multi-Scale Pennant Analysis
One of the key advantages of Chart Pattern Pennant is the ability to analyze different pattern sizes.
Small Pennant Patterns
Small patterns can help traders examine more localized price structures.
These formations may be useful when studying shorter-term consolidation behavior or more recent chart activity.
Medium Pennant Patterns
Medium patterns provide a broader structural view.
They can help traders examine formations that develop over a larger section of price history.
Large Pennant Patterns
Large patterns are intended for traders interested in broader chart structures.
They can provide additional context when analyzing more substantial consolidation formations.
Because each size category can be enabled independently, traders can determine how much structural information they want displayed.
Designed for TradingView
Chart Pattern Pennant is built specifically for TradingView and operates as an overlay directly on the price chart.
The detected pennant boundaries are displayed in the same chart area as price, making it possible to study the relationship between the pattern and subsequent market movement without switching between separate indicator panels.
This chart-based presentation makes the indicator suitable for traders who prefer visual price-structure analysis.
A Practical Workflow for Using Chart Pattern Pennant
Step 1: Select the Pattern Directions
Choose whether you want to monitor:
- Bullish Pennants
- Bearish Pennants
- Both
Step 2: Select Pattern Sizes
Enable small, medium, large, or multiple pattern categories depending on the type of structure you want to study.
Step 3: Configure the Visual Appearance
Choose your preferred:
- Line style
- Line width
- Upper line color
- Lower line color
- Breakout marker color
Step 4: Adjust the Extension
Set the number of extension bars to control how far detected boundaries continue forward.
Step 5: Decide Whether to Keep Historical Patterns
Enable Show Last Pattern Only for a cleaner chart focused on the latest formation.
Leave it disabled when historical pattern visualization is useful.
Step 6: Enable Alerts if Desired
Turn on the alert setting if you want notifications for newly detected pennants and supported bearish breakout events.
Why Use Chart Pattern Pennant for TradingView?
Manually identifying a pennant requires traders to search for appropriate swing points, compare the resulting highs and lows, evaluate whether the structure is sufficiently convergent, and draw the corresponding boundaries.
Chart Pattern Pennant automates this chart-pattern recognition process and presents qualifying structures visually.
Its combination of:
- Automatic bullish pennant detection
- Automatic bearish pennant detection
- Small, medium, and large pattern sizes
- Adjustable forward extensions
- Optional latest-pattern display
- Custom line styles
- Adjustable line width
- Independent boundary colors
- Optional alerts
- Bearish breakout monitoring
- Visual breakout markers
- TradingView chart integration
provides a practical framework for traders who want to incorporate pennant-pattern analysis into their technical workflow.
Chart Pattern Pennant Settings
The indicator provides several user-facing configuration groups.
Pattern Toggles
- Show Bullish Pennant
- Show Bearish Pennant
Pattern Sizes
- Enable Small Pattern
- Enable Medium Pattern
- Enable Large Pattern
Parameters
- Show Last Pattern Only
- Alert
- Extension Bars
Line Style
- Line Style
- Line Width
- Upper Line Color
- Lower Line Color
- Breakout Cross Color
These controls allow traders to configure both pattern visibility and chart presentation without exposing or requiring knowledge of the underlying detection process.
Built for Visual Pattern Recognition
Chart Pattern Pennant is designed around a straightforward concept: make qualifying pennant formations easier to find and easier to study.
Rather than relying entirely on manual pattern drawing, traders can allow the indicator to continuously monitor price structure and visually identify formations that meet its internal criteria.
The result is a cleaner and more systematic approach to incorporating pennant analysis into a TradingView workflow.
Frequently Asked Questions
What is Chart Pattern Pennant for TradingView?
Chart Pattern Pennant is a TradingView indicator that automatically identifies bullish and bearish pennant formations and displays their converging boundaries directly on the price chart.
Does it detect both bullish and bearish pennants?
Yes. Bullish and bearish pennant detection can be enabled independently.
Can I choose the size of pennant patterns?
Yes. The indicator provides Small, Medium, and Large pattern categories that can be enabled or disabled individually.
Can I display only the latest pennant?
Yes. The Show Last Pattern Only option allows you to focus the chart on the latest detected pattern.
Can I customize the pennant lines?
Yes. You can customize the line style, line width, upper boundary color, and lower boundary color.
Can the pennant lines be extended?
Yes. The Extension Bars setting controls the forward extension of the detected pattern boundaries.
Does Chart Pattern Pennant provide alerts?
Yes. Optional alerts are available for newly detected bullish and bearish pennant patterns, as well as the supported bearish lower-line breakout event.
Does it identify bearish pennant breakouts?
The indicator includes dedicated monitoring for a bearish pennant lower-boundary breakout and can display a breakout marker when its breakout conditions are met.
Is this a complete trading strategy?
No. Chart Pattern Pennant is a technical analysis and pattern-recognition tool. A detected pattern should be evaluated within the context of the trader’s broader methodology, market conditions, confirmation criteria, and risk management.
Does the product expose its detection algorithm?
No. The indicator provides the necessary user-facing controls and chart output while keeping the proprietary pattern-detection methodology private.
Chart Pattern Pennant for TradingView
Automatically identify bullish and bearish pennant patterns directly on your TradingView charts.
Chart Pattern Pennant combines automated pattern recognition, multiple pattern sizes, customizable converging boundaries, optional alerts, and bearish breakout monitoring in a dedicated TradingView chart-pattern tool.
Whether you are studying historical price formations or monitoring live markets for emerging pennant structures, Chart Pattern Pennant provides a systematic visual framework for incorporating pennant analysis into your trading workflow.