Identify Structured Price Channels Directly on Your TradingView Charts
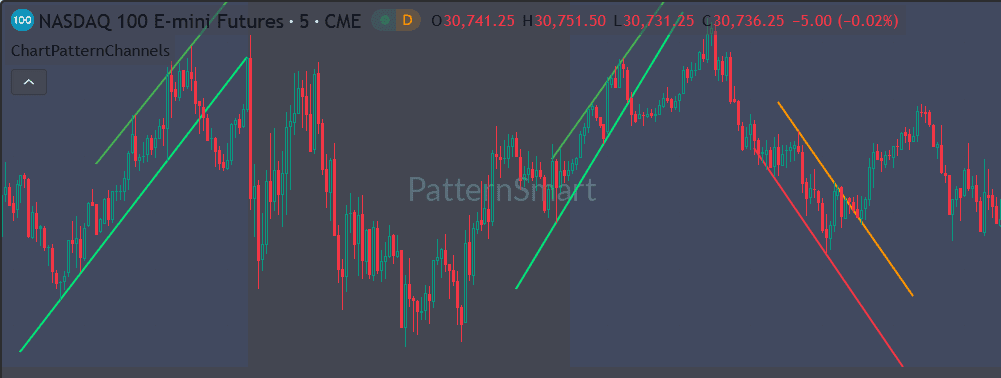
Chart Pattern Channel for TradingView is a specialized chart-pattern indicator designed to help traders identify and visualize upward and downward price channels directly on the chart.
Instead of manually searching through historical swing points and drawing channel lines by hand, the indicator automatically evaluates price structure and displays qualifying channel formations with clearly defined upper and lower boundaries.
It supports small, medium, and large channel patterns, configurable visual styles, adjustable extensions, optional alerts, and the ability to display only the most recent detected pattern.
Whether you analyze stocks, futures, forex, or other markets on TradingView, Chart Pattern Channel provides a structured way to study channel formations and their relationship with ongoing price movement.
What Is Chart Pattern Channel?
A price channel is a chart structure in which price develops between two directional boundaries. When both boundaries generally move upward, traders can study an upward channel. When both boundaries move downward, the structure forms a downward channel.
Chart Pattern Channel is built specifically to detect these types of formations and draw them on the TradingView chart.
The indicator evaluates multiple pattern sizes and looks for qualifying relationships between recent swing highs and swing lows. When a valid formation is identified, the corresponding channel boundaries are plotted on the price chart.
This gives traders a visual framework for studying:
- Directional price structure
- Rising and falling channels
- Swing-high relationships
- Swing-low relationships
- Potential channel continuation
- Channel development over time
- Historical chart patterns
The goal is not to predict the market, but to make relevant chart structures easier to recognize and analyze.
Key Features
Automatic Channel Pattern Detection
Chart Pattern Channel continuously evaluates the chart for qualifying channel formations.
When a pattern is detected, the indicator draws its upper and lower boundaries directly on the price chart. This can reduce the need to manually locate swing points and construct channel lines.
Channel UP and Channel Down
The indicator supports two primary pattern directions:
- Channel UP — identifies qualifying upward channel structures.
- Channel Down — identifies qualifying downward channel structures.
You can enable or disable either pattern type independently.
This allows traders to focus exclusively on the channel direction relevant to their analysis.
Three Pattern Sizes
Chart Pattern Channel provides three pattern-size categories:
- Small
- Medium
- Large
These categories allow traders to control which channel structures are considered during detection.
For example, a trader concentrating on shorter-term chart structures can enable smaller patterns, while a trader interested in broader formations can focus on medium or large patterns.
You can also enable all three categories simultaneously.
Extend Channel Lines Into the Future
Once a qualifying channel has been identified, the indicator can extend its boundaries beyond the currently established formation.
The Extension Bars setting controls how far the channel lines continue forward.
This can make the developing structure easier to monitor as new price bars appear.
Rather than ending the lines exactly at the latest identified swing points, the extended boundaries provide a visual reference for observing how subsequent price action interacts with the projected channel structure.
Show Only the Latest Pattern
For traders who prefer a cleaner chart, Chart Pattern Channel includes a Show Last Pattern Only option.
When enabled, previous channel drawings of the corresponding pattern direction are removed as new qualifying formations are detected.
This provides a simplified chart focused on the latest detected channel instead of displaying numerous historical formations simultaneously.
If you prefer historical pattern analysis, this option can remain disabled so that detected channel structures can remain visible.
Customizable Channel Appearance
Chart Pattern Channel gives you control over how detected formations appear on your TradingView chart.
Line Style
Choose from:
- Solid
- Dashed
- Dotted
Line Width
The channel line width can also be adjusted to suit your chart layout and visual preferences.
Independent Channel Colors
Bullish and bearish channel boundaries can be visually distinguished using separate color settings.
You can customize:
- Bullish upper line
- Bullish lower line
- Bearish upper line
- Bearish lower line
This makes it easier to distinguish channel direction at a glance.
How Chart Pattern Channel Works
Chart Pattern Channel is designed around the structural relationship between price swing points.
The indicator evaluates recent swing highs and swing lows and determines whether their relationships satisfy the conditions required for a qualifying upward or downward channel.
For an upward channel, the detected structure involves rising high and low relationships with appropriately aligned channel boundaries.
For a downward channel, the indicator evaluates the corresponding declining high and low structure.
The detection process also evaluates the arrangement and spacing of the relevant swing points rather than simply drawing lines between arbitrary highs and lows.
This helps keep the displayed formations focused on structured channel patterns rather than every possible pair of price points.
The proprietary detection logic is intentionally not exposed.
Multi-Scale Chart Pattern Analysis
One of the useful characteristics of Chart Pattern Channel is its ability to evaluate multiple pattern sizes.
Instead of relying on a single fixed structural scale, the indicator can examine several ranges corresponding to small, medium, and large formations.
This allows the same indicator to be used for different types of chart analysis.
Small Patterns
Useful for examining more localized price structures and shorter-term channel formations.
Medium Patterns
Useful for studying intermediate chart structures that develop over a broader section of price action.
Large Patterns
Useful for identifying larger channel formations and broader directional structures.
Traders can enable one, two, or all three categories depending on how much structural information they want displayed.
Use Chart Pattern Channel as a Structural Analysis Tool
Chart Pattern Channel is not designed to replace a complete trading methodology.
Instead, it provides a visual framework that can be combined with your existing analysis.
For example, traders may use detected channels alongside:
- Price action
- Support and resistance
- Trend analysis
- Volume analysis
- Moving averages
- Momentum indicators
- Breakout analysis
- Risk management
- Multiple-timeframe analysis
A channel can provide context for understanding where price is moving within a broader structure.
The indicator therefore works naturally as part of a larger technical-analysis workflow.
Alerts for New Channel Patterns
Chart Pattern Channel includes an optional alert setting.
When enabled, the indicator can generate an alert when a new Channel UP or Channel Down formation is detected.
The alert functionality can help traders monitor charts without continuously watching every bar for a newly appearing pattern.
This is particularly useful when monitoring multiple TradingView charts or markets.
Designed for TradingView
Chart Pattern Channel is developed specifically for TradingView and operates directly as an overlay on the price chart.
The channel boundaries are drawn using the chart’s historical price coordinates, allowing the formations to remain visually connected to the price structure from which they were identified.
Because the indicator is displayed directly over price, traders can evaluate channel formations without needing to switch to a separate indicator panel.
Practical Ways to Use Chart Pattern Channel
Study Trend Structure
Use upward and downward channels to visually examine the directional structure of the market.
Monitor Developing Channels
Extended channel boundaries can provide reference points as new price bars develop.
Analyze Historical Patterns
Keep previous patterns visible to study how different channel formations developed across historical price action.
Simplify Your Chart
Enable Show Last Pattern Only when you want to concentrate on the latest detected formation.
Compare Different Pattern Scales
Enable small, medium, and large patterns together to study channel structures at different scales.
Why Use Chart Pattern Channel for TradingView?
Manually drawing channels can require repeatedly searching for appropriate swing highs and lows, checking whether the resulting boundaries form a meaningful structure, and extending those lines as the chart develops.
Chart Pattern Channel automates this structural scanning process and presents qualifying formations directly on the chart.
Its combination of:
- Automatic channel detection
- Channel UP and Channel Down recognition
- Small, medium, and large pattern sizes
- Adjustable line extensions
- Optional latest-pattern display
- Custom line styles
- Adjustable line width
- Independent channel colors
- Optional alerts
- TradingView chart integration
makes it a practical tool for traders who want a more systematic way to study price channels.
Chart Pattern Channel Settings
The indicator provides several groups of settings for controlling detection and presentation.
Pattern Toggles
- Show Channel UP
- Show Channel Down
Pattern Sizes
- Enable Small
- Enable Medium
- Enable Large
Parameters
- Show last pattern only
- Alert
- Extension Bars
Line Style
- Solid
- Dashed
- Dotted
- Line Width
Line Colors
- Bullish Upper Line
- Bullish Lower Line
- Bearish Upper Line
- Bearish Lower Line
These settings allow the indicator to be adapted to different chart layouts and analytical preferences.
A Cleaner Approach to Channel Analysis
Chart Pattern Channel is built for traders who want channel structures to become part of their regular chart-reading process without manually constructing every formation.
By automatically identifying qualifying upward and downward channel structures and presenting them visually on the TradingView chart, it provides a consistent framework for studying directional price behavior.
Use it to discover potential channel structures, examine historical formations, monitor developing price action, and combine channel analysis with your broader trading methodology.
Frequently Asked Questions
What is Chart Pattern Channel for TradingView?
Chart Pattern Channel is a TradingView chart overlay that automatically identifies qualifying upward and downward price channel formations and draws their boundaries directly on the chart.
Does it detect both rising and falling channels?
Yes. The indicator supports both Channel UP and Channel Down patterns, and either direction can be enabled or disabled independently.
Can I choose different channel pattern sizes?
Yes. Small, medium, and large pattern categories can be enabled independently.
Can I display only the latest channel?
Yes. The Show Last Pattern Only option allows the chart to focus on the latest detected pattern instead of retaining previous channel drawings.
Can the channel lines be extended?
Yes. The Extension Bars setting controls the forward extension of detected channel boundaries.
Can I customize the appearance?
Yes. You can customize line style, line width, and the colors used for bullish and bearish channel boundaries.
Does Chart Pattern Channel provide alerts?
Yes. An optional alert function can notify you when a new Channel UP or Channel Down pattern is detected.
Does the indicator reveal its detection algorithm?
No. The product exposes user-facing settings and chart outputs while keeping the underlying proprietary detection logic private.
Is Chart Pattern Channel a complete trading strategy?
No. It is a chart-pattern analysis tool designed to help traders identify and study channel structures. Trading decisions should incorporate the trader’s own analysis, risk management, and methodology.
Chart Pattern Channel for TradingView
Automatically identify structured price channels. Visualize upward and downward formations. Analyze multiple pattern sizes. Customize the display. Monitor new patterns with optional alerts.
Chart Pattern Channel brings automated channel-pattern analysis directly to your TradingView charts, giving traders a practical visual tool for studying market structure without manually drawing every channel.