Thinkorswim EMA Pullback Reclaim Scanner with Volume Confirmation: Complete thinkScript
Purpose: This Thinkorswim Stock Hacker scan identifies stocks in a bullish longer-term trend that closed at or below the 20-period exponential moving average (EMA) on the previous bar and have now reclaimed that EMA on above-normal volume. It provides a focused list for chart review rather than an automatic trading signal.
Why an EMA Reclaim and Volume Confirmation Work Together
Strong uptrends frequently include short pullbacks. A recovery above a short-term moving average can indicate that buyers are regaining control; however, a price-only reclaim can be fragile. The volume condition asks whether the current bar also shows greater-than-usual participation. No single signal guarantees trend continuation, especially around earnings, gaps, or broad-market reversals.
Core Logic and Exact Signal Conditions
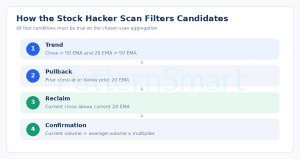
- Bullish structure: latest close is above the 50 EMA, and the 20 EMA is above the 50 EMA.
- Optional rising trend filter: 50 EMA is above its value five bars ago.
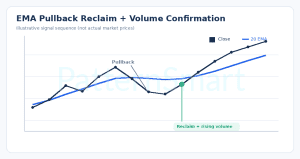
- Pullback and reclaim: previous bar closed at or below its own 20 EMA, while the current bar closes above the current 20 EMA.
- Relative volume: current bar volume exceeds 1.30 times the average of the prior 20 bars' volume, excluding the current bar.
- Minimum price: current close is $5.00 or higher.
The script is explicitly bullish. A bearish variant could require a close below a falling 50 EMA, a fast EMA below the slow EMA, and a downward rejection of the 20 EMA. That reverse condition is not included in this scan.
Figure 1. An illustrative EMA pullback, reclaim and volume-confirmed entry condition. The attached ema_reclaim_signal.png is a schematic, not actual historical market data.
Parameters
| Input | Default | Interpretation |
|---|---|---|
| fastLength | 20 | Short EMA; a shorter period responds more quickly but can produce extra noise. |
| slowLength | 50 | Underlying trend; a longer setting makes trend qualification slower. |
| volumeLength | 20 | Previous-bar average volume lookback. |
| volumeMultiplier | 1.30 | Threshold; 1.50 is stricter, while 1.10 is less selective. |
| minPrice | 5.00 | Basic price filter; not a liquidity or risk measure. |
| requireSlowEMARising | yes | Requires an upward 50-EMA slope when enabled. |
| slowSlopeLookback | 5 | Number of bars over which the slow EMA slope is measured. |
Figure 2. The scan qualification flow, available in the attached scan_filter_logic.png. All configured filters must pass on the selected aggregation.
Complete thinkScript — Stock Hacker Custom Study Filter
This is a Stock Hacker study filter, not a chart study overlay. It uses a single Boolean plot called scan. Paste the complete script, including its input declarations, into the custom study editor.
# EMA Pullback Reclaim + Volume Confirmation # Stock Hacker custom study filter: exactly one plot # Suggested scan aggregation: Day
input fastLength = 20; input slowLength = 50; input volumeLength = 20; input volumeMultiplier = 1.30; input minPrice = 5.00; input requireSlowEMARising = yes; input slowSlopeLookback = 5;
def fastEMA = ExpAverage(close, fastLength); def slowEMA = ExpAverage(close, slowLength); # Exclude current bar from the volume baseline. def priorAvgVolume = Average(volume[1], volumeLength);
def uptrend = close > slowEMA and fastEMA > slowEMA; def risingSlowEMA = slowEMA > slowEMA[slowSlopeLookback]; def pullbackReclaim = close[1] <= fastEMA[1] and close > fastEMA; def volumeConfirmed = volume > priorAvgVolume * volumeMultiplier; def priceEligible = close >= minPrice;
plot scan = uptrend     and (if requireSlowEMARising then risingSlowEMA else yes)     and pullbackReclaim     and volumeConfirmed     and priceEligible;
Installation in Thinkorswim
- Open the desktop platform and navigate to Scan → Stock Hacker.
- Select the desired stock universe or watchlist. Add a Study filter, choose Custom, and open its thinkScript editor.
- Replace the default code with the entire script and save the custom study filter.
- Choose a Day aggregation for the default daily-bar configuration and run the scan.
- Inspect each qualifying stock on its chart, including spread, nearby resistance, earnings schedule and broader market conditions.
Example Setups
Qualified case: a $75 stock is above a rising 50 EMA, its 20 EMA is also above the 50 EMA, and yesterday's close was below the 20 EMA. Today's close is above the 20 EMA with 2.0 million shares traded. The prior 20-bar average is 1.4 million. Relative volume is approximately 1.43, exceeding the 1.30 threshold, so the scan can return true if all other conditions also hold.
Rejected case: the same price structure occurs with only 1.2 million shares. The required threshold is 1.82 million (1.4 million × 1.30). The volume test fails and the result is filtered out.
Lookahead, Repainting and False Signals
This code does not intentionally reference future bars. It measures current and prior bars; however, the latest bar is live until it closes. On a daily scan, an intraday price reclaim may vanish before the session close, and volume comparisons against full-day historical volume are less meaningful early in the day. For more reliable evaluation, review signals on completed daily bars. The scan does not freeze or backfill its intraday states.
False positives may occur during earnings gaps, market-wide whipsaws, thinly traded stocks, prolonged sideways markets, or rallies that immediately run into overhead resistance. The minPrice check does not measure bid-ask spreads, average dollar volume or slippage. EMA calculations may also depend on available chart history and the platform's indicator initialization.
Validation Checklist
- Confirm the selected symbol has enough history for 50 EMA plus the slope and volume lookbacks.
- Use positive lookback lengths and a sensible nonnegative volume multiplier.
- Compare several passing and failing stocks visually against the exact conditions.
- Test with and without the rising slow EMA filter and across different market regimes.
- Forward-test or paper-trade before risking capital. This sample has not been compiled or executed in a live thinkorswim terminal.
Further Customization
Potential improvements include a minimum average dollar-volume condition, a flexible two-to-three-bar pullback window, or a separate higher-timeframe trend check. Traders seeking tailored scan development, custom technical indicators or other platform-specific functionality can explore Custom Trading Software Development Services.
Disclaimer: Educational information only, not investment advice. Trading can result in losses. Verify scripts and settings in your own Thinkorswim environment before using them for decisions.