NinjaTrader 8 Confirmed EMA Cross Audit: One Signal Per Closed Bar
Trading Tips | Practical NinjaScript C# debugging
The debugging problem
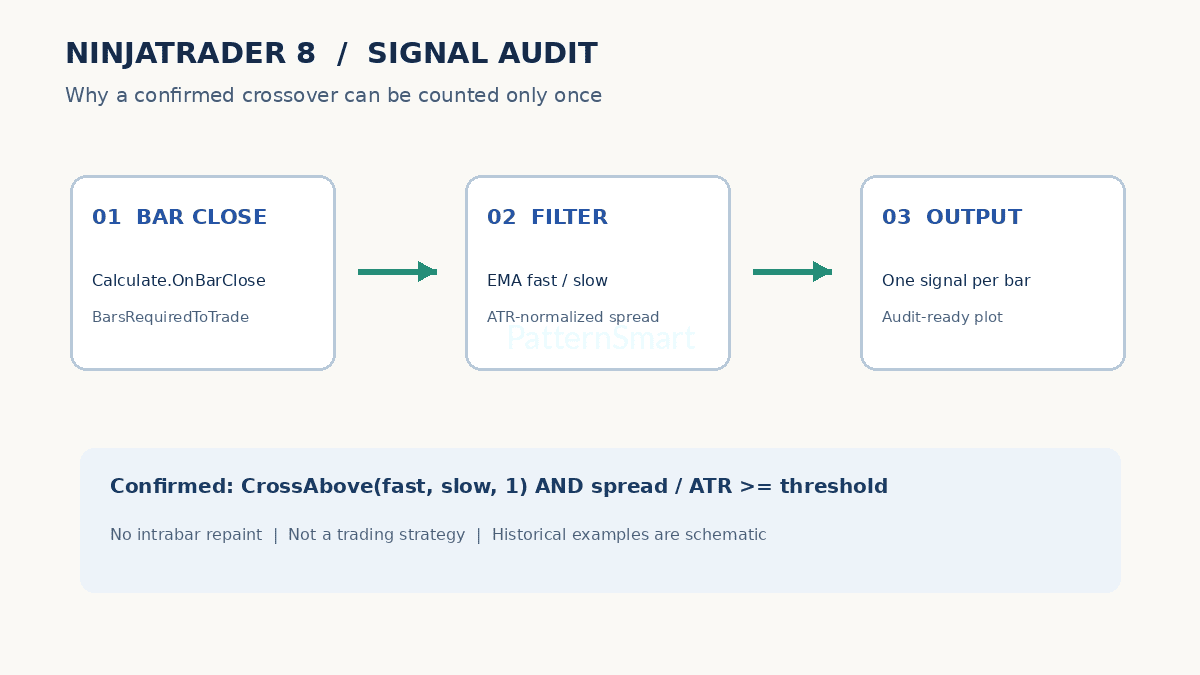
A crossover that looks obvious on a completed chart can be surprisingly hard to audit in live processing. A signal computed on every tick may appear, disappear, and reappear before a candle closes. This indicator intentionally works on closed bars and emits a numeric event only when a new fast/slow EMA crossover survives a volatility-normalized separation filter. It is a research instrument, not an order-entry system.
How the two gates work
The first gate is a one-bar crossing: the fast EMA changes from at-or-below to above the slow EMA for bullish events, or the reverse for bearish events. The second gate computes absolute EMA spread divided by ATR. This dimensionless ratio permits the same threshold to be interpreted across instruments with different price scales. The gate is evaluated on the crossover bar, so a delayed spread increase will not create a late crossover signal.
A reproducible hypothetical example
Suppose the newly closed bar has fast EMA 101.12, slow EMA 101.08 and ATR 1.60. Its normalized spread is 0.04 / 1.60 = 0.025. With threshold 0.02, the filter passes. If the previous bar had fast EMA no higher than slow EMA, the bullish plot becomes 1 for this bar. If the previous bar was already bullish, no event is emitted. If ATR is zero, the calculation is skipped.
What the parameters actually change
FastPeriod 9 responds more quickly than SlowPeriod 21, at the cost of more frequent crossing. AtrPeriod 14 determines the volatility baseline. MinNormalizedSpread 0.02 rejects crosses with very little separation at the close. A larger threshold reduces accepted events but can discard legitimate early moves. Keep FastPeriod below SlowPeriod; the code intentionally returns no events when that relationship is invalid.
Install and inspect
In NinjaTrader 8, open New > NinjaScript Editor, create an Indicator named ConfirmedEmaCrossAudit, replace its generated class with the complete code below and compile. Add it to a chart with sufficient history. The lower panel plots +1 for accepted bullish crosses and -1 for accepted bearish crosses; zero means no accepted crossover. Use Data Box or exported indicator values to compare events against closed chart bars.
Complete NinjaScript indicator source
#region Using declarations
using System;
using System.ComponentModel;
using System.ComponentModel.DataAnnotations;
using System.Windows.Media;
using NinjaTrader.Data;
using NinjaTrader.Gui.Chart;
using NinjaTrader.NinjaScript;
using NinjaTrader.NinjaScript.Indicators;
#endregion

namespace NinjaTrader.NinjaScript.Indicators
{
    public class ConfirmedEmaCrossAudit : Indicator
    {
        private EMA fastEma;
        private EMA slowEma;
        private ATR atr;

        [NinjaScriptProperty]
        [Range(2, 100)]
        [Display(Name = "Fast period", GroupName = "Parameters", Order = 0)]
        public int FastPeriod { get; set; }

        [NinjaScriptProperty]
        [Range(3, 300)]
        [Display(Name = "Slow period", GroupName = "Parameters", Order = 1)]
        public int SlowPeriod { get; set; }

        [NinjaScriptProperty]
        [Range(2, 100)]
        [Display(Name = "ATR period", GroupName = "Parameters", Order = 2)]
        public int AtrPeriod { get; set; }

        [NinjaScriptProperty]
        [Range(0.0, 5.0)]
        [Display(Name = "Minimum spread / ATR", GroupName = "Parameters", Order = 3)]
        public double MinNormalizedSpread { get; set; }

        protected override void OnStateChange()
        {
            if (State == State.SetDefaults)
            {
                Description = "Confirmed-bar EMA cross audit with ATR-normalized spread.";
                Name = "ConfirmedEmaCrossAudit";
                Calculate = Calculate.OnBarClose;
                IsOverlay = false;
                IsSuspendedWhileInactive = true;
                FastPeriod = 9;
                SlowPeriod = 21;
                AtrPeriod = 14;
                MinNormalizedSpread = 0.02;
                AddPlot(Brushes.DodgerBlue, "BullishEvent");
                AddPlot(Brushes.IndianRed, "BearishEvent");
            }
            else if (State == State.DataLoaded)
            {
                fastEma = EMA(FastPeriod);
                slowEma = EMA(SlowPeriod);
                atr = ATR(AtrPeriod);
            }
        }

        protected override void OnBarUpdate()
        {
            Values[0][0] = 0;
            Values[1][0] = 0;
            if (FastPeriod >= SlowPeriod || CurrentBar < Math.Max(SlowPeriod, AtrPeriod) + 1)
                return;

            double volatility = atr[0];
            if (volatility <= 0)
                return;

            double spread = Math.Abs(fastEma[0] - slowEma[0]) / volatility;
            if (spread < MinNormalizedSpread)
                return;

            if (CrossAbove(fastEma, slowEma, 1))
                Values[0][0] = 1;
            else if (CrossBelow(fastEma, slowEma, 1))
                Values[1][0] = -1;
        }
    }
}
Why the signal may differ from expectations
The signal uses bar-close processing, not intrabar execution. In a live chart the event becomes final only when the bar closes. Historical bar processing and live event timing can differ around data gaps, session changes, trading-hours templates, or revised historical feeds. CrossAbove/CrossBelow uses a lookback of one bar. The indicator does not place orders, account for spreads, model slippage, or guarantee a trend will continue.
Validation protocol
First inspect a chart with FastPeriod 9, SlowPeriod 21, ATR 14 and threshold 0.02. Check a known crossing and independently calculate the normalized spread. Next set threshold to zero and confirm that more weak crossings pass. Increase the threshold and verify that accepted events do not increase. Test flat/zero-range periods, session boundaries, different bar types, and reloads. Finally compare the plot against an independent spreadsheet calculation before using it in any strategy research.
Research and risk
An event plot is not a profitable strategy. Repeated optimization of the threshold on one market can overfit noise; use out-of-sample instruments and dates, realistic transaction costs and stable bar settings. Compile and review this source in your installed NinjaTrader 8 build before relying on it.
Interested in adapting this free source to your workflow? Explore our Custom Trading Software Development Services to discuss practical customization.