Thinkorswim Stock Hacker: A Confirmed-Bar Expansion and Relative-Volume Scan
Trading Tips | thinkScript | Practical scan engineering. A large candle alone is not a meaningful screening rule. A candle can be large because of a temporary quote, an illiquid print, or an unfinished session. This tutorial builds a deliberately conservative Stock Hacker filter that combines completed-bar range expansion, close location, and relative volume, and explains why using one completed bar consistently is more important than adding extra conditions.
The operational problem: results that change while you watch
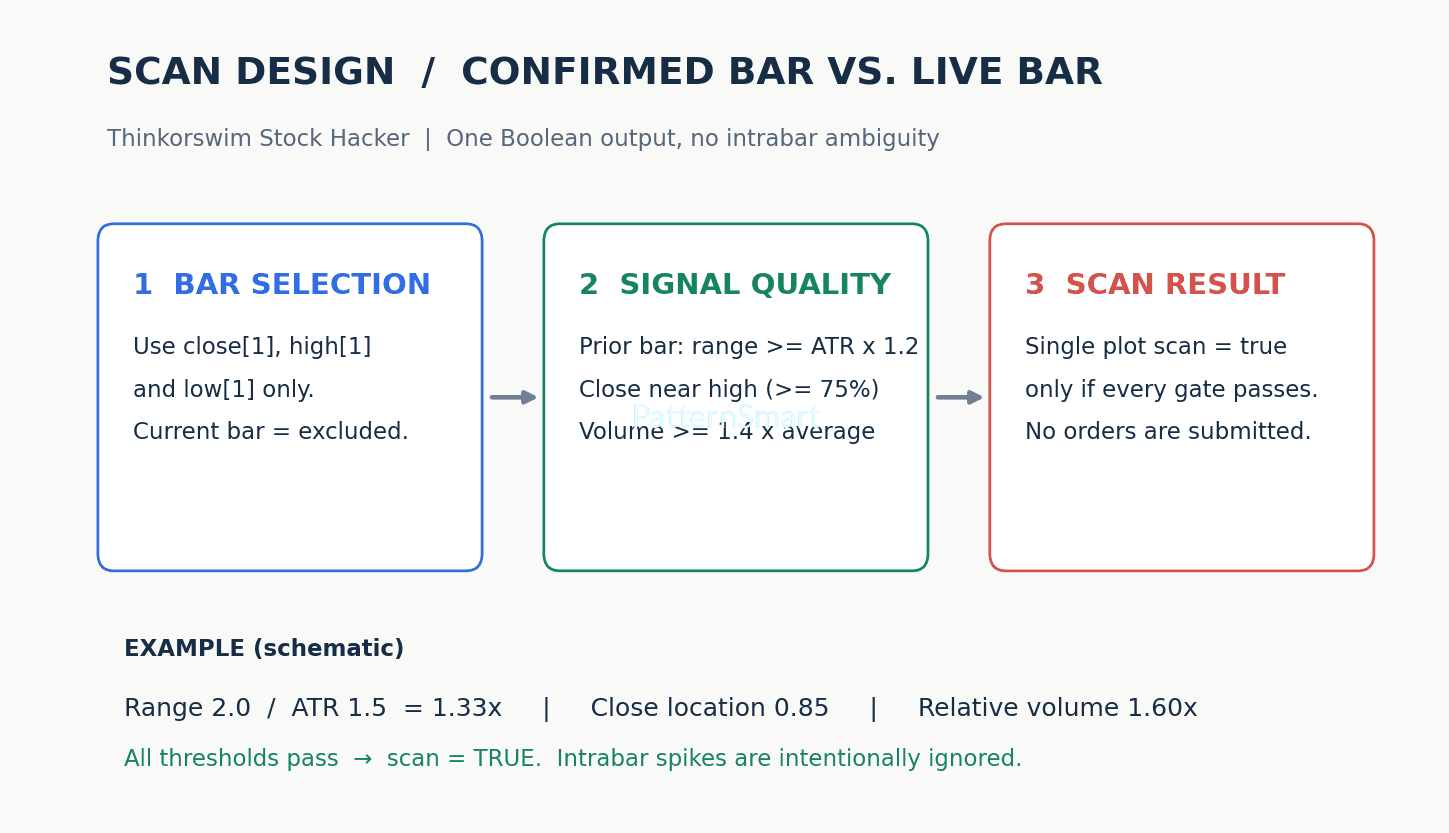
Stock Hacker scans run on a selected aggregation, and the latest bar may still be forming. A rule that compares the live high, close and volume can appear to pass, disappear, and pass again before the bar closes. That is not necessarily a software defect: the inputs are changing. For a repeatable research workflow, the script below evaluates bar [1], the last completed candle, while the current candle is bar [0]. This creates a stable historical reference for a scan performed during the next candle. It also means the scan does not claim to detect an event as soon as it occurs.
Three complementary gates, not three copies of the same idea
Range expansion measures the completed bar's high minus low relative to its ATR. A ratio of at least 1.20 requires the candle to span at least 120% of the recent average true range. ATR itself incorporates gaps via true range, so it is not the same as average high-low range. Close location measures where the closing price sits inside the candle: (close − low)/(high − low). A value of 0.75 means the close lies in the upper quarter of that bar's full range. Relative volume compares the completed bar's volume to the 20-bar simple mean, requiring at least 1.40 times that baseline. The optional up-close filter requires close > open.
These gates serve distinct purposes. Expansion identifies unusual movement relative to recent volatility; location asks whether price retained a substantial portion of the bar's upside travel; volume asks whether the move occurred with unusually active participation. None proves that buyers are informed, that the move will continue, or that the next bar will be profitable. For instruments with irregular volume reporting or very thin trading, the volume condition may be misleading.
Worked numerical example
Assume a hypothetical completed bar has high 104.00, low 102.00, open 102.40, close 103.70, ATR 1.50, volume 160,000, and 20-bar average volume 100,000. Range is 2.00; range/ATR = 1.333, above 1.20. Close location is (103.70−102.00)/2.00 = 0.85, above 0.75. Relative volume is 160,000/100,000 = 1.60, above 1.40. The bar closed above its open. Every gate passes, so the Boolean scan is true. If the close were 103.20, location would be 0.60 and the result would be false even though range and volume still pass. These numbers are schematic, not historical market observations.
Implementation choices that avoid common scanner errors
The script uses a single output named scan, as required for a Stock Hacker custom study filter. All price and volume observations refer to the same completed bar. The ATR and average-volume baselines are also indexed [1] so that no unfinished-bar data contaminates the comparisons. A zero range produces a location of zero instead of division by zero; nonpositive ATR and baseline volume fail their respective gates. The script is a scanner, not a chart overlay, alert engine, or automatic trading strategy.
Complete thinkScript source
Copy the entire listing into a Stock Hacker custom study filter. Keep the scan aggregation aligned with the market and research horizon you intend to study.
# Confirmed-Bar Expansion Quality Scan for Stock Hacker
# The scan evaluates the most recently COMPLETED bar.
# Set Stock Hacker aggregation to the timeframe you want.
input atrLength = 14;
input averageVolumeLength = 20;
input minimumRangeATR = 1.20;
input minimumCloseLocation = 0.75;
input minimumRelativeVolume = 1.40;
input requireUpClose = yes;

# Completed bar [1] is compared with information available at [1].
def completedRange = high[1] - low[1];
def priorATR = Average(TrueRange(high, close, low), atrLength)[1];
def priorAverageVolume = Average(volume, averageVolumeLength)[1];
def location = if completedRange > 0 then
    (close[1] - low[1]) / completedRange else 0;
def rangePass = priorATR > 0 and
    completedRange >= minimumRangeATR * priorATR;
def locationPass = location >= minimumCloseLocation;
def volumePass = priorAverageVolume > 0 and
    volume[1] >= minimumRelativeVolume * priorAverageVolume;
def directionPass = !requireUpClose or close[1] > open[1];

# Stock Hacker requires a single Boolean plot.
plot scan = rangePass and locationPass and volumePass and directionPass;
Parameter decisions and practical variations
| Setting | Default | Interpretation and trade-off |
|---|---|---|
| atrLength | 14 | Longer length smooths volatility estimates but adapts more slowly to regime changes. |
| averageVolumeLength | 20 | Longer baselines damp unusual sessions; shorter ones respond faster. |
| minimumRangeATR | 1.20 | Higher values select rarer, larger expansion bars. |
| minimumCloseLocation | 0.75 | Higher values demand stronger upper-range closes. |
| minimumRelativeVolume | 1.40 | Higher values reject ordinary participation but may exclude valid moves. |
| requireUpClose | yes | Disable to inspect expansion bars regardless of candle body direction. |
Installation, use and validation
Open the Scan tab, choose Stock Hacker, add a Study filter, open the custom thinkScript editor, replace its content with the listing, and save. Choose a supported aggregation and an appropriate universe of symbols. The scan should return only symbols whose most recently completed bar meets every gate. On a chart of a candidate, inspect the prior candle rather than the still-forming current candle. If the scan aggregation and chart aggregation differ, the visual comparison is not valid.
For a reproducibility check, select one symbol and calculate the four gate values by hand from the same completed candle. Test a zero-range candle, a low-volume candle, a wide candle that closes near its low, and a candidate with an intrabar spike but a failed final close. Run the scan again during the current candle and verify that a candidate's completed-bar inputs remain unchanged. Remember that a new completed bar will replace [1] at the next bar transition, so results can legitimately change then.
What can still go wrong?
High volume can be caused by a news shock, opening auction, or distribution rather than trend continuation. ATR may be elevated after volatility shocks, making subsequent expansions harder to qualify. Market hours, extended-session data, symbol liquidity, corporate actions, aggregation availability, and scanner engine restrictions affect results. A fixed volume threshold may behave differently across asset classes. No lookahead is intentionally used, but historical data revisions and scanner refresh timing can change what is displayed. The source has not been compiled or verified on a live thinkorswim installation; review it in the platform before relying on it.
Research use and risk perspective
Treat this as a candidate-discovery utility. Log both matches and near-misses, stratify by session and instrument liquidity, and compare forward outcomes only after defining objective entry, exit, costs, and position sizing rules. A scan result is not an entry order, a guaranteed breakout, or investment advice. Slippage, gaps, fees, and regime changes can overwhelm a visually attractive signal. Interested in adapting this free scanner to your workflow? Explore our Custom Trading Software Development Services to discuss a tailored implementation.