MultiCharts .NET Closed-Bar Breakout Audit: Filter Intrabar Noise with C#
Trading Tips | PowerLanguage .NET | Free research indicator
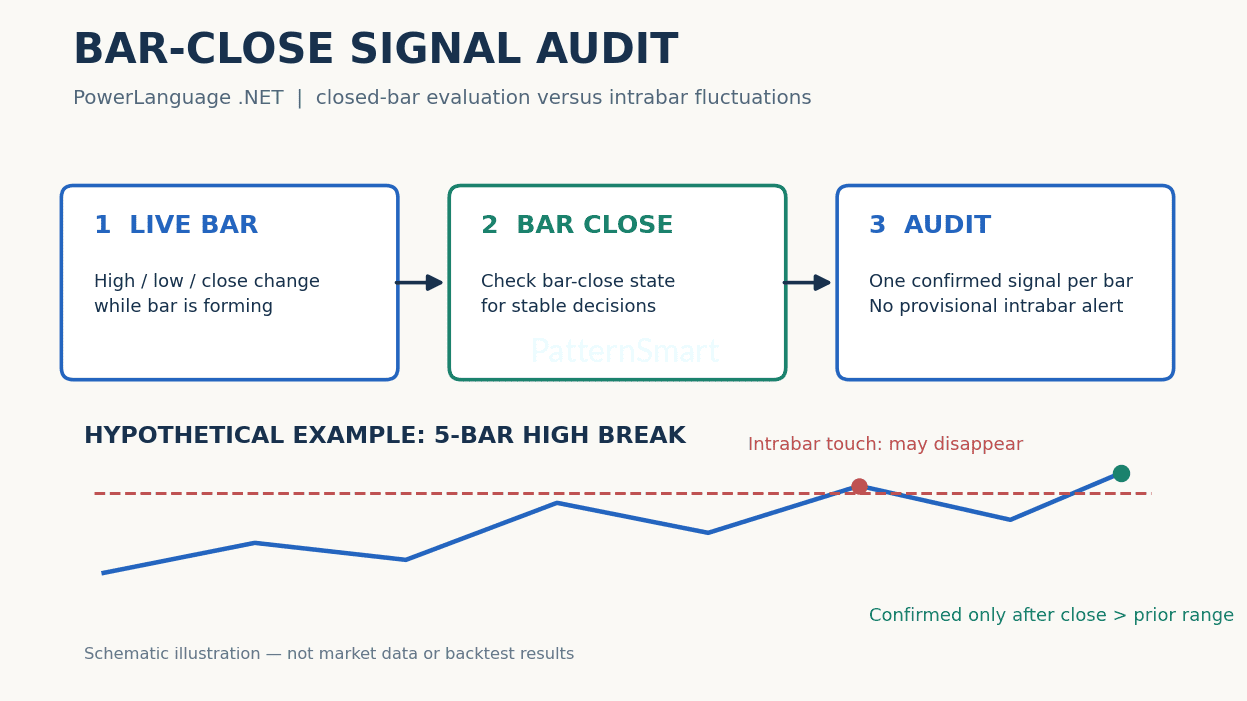
A price touching a prior high during an unfinished bar is not the same event as a confirmed breakout. Intrabar values can reverse before the bar closes, leaving misleading alerts, mismatched chart markers, and research results that do not correspond to what an operator saw in real time. This practical study uses a bar-close gate and a relative range filter to create an auditable visual signal. It does not submit orders.
The research question
Can we identify completed bars whose closing price clears the highest high of the previous five bars, while requiring the new bar to be meaningfully wider than the recent typical bar? The logic separates three questions: whether the bar is final, whether price closes beyond the previous range, and whether the current high-low range is large enough to matter.
Exact rules and worked example
Let Hprev be the maximum high of bars 1 through N, excluding the current bar. Let Ravg be the arithmetic mean of the previous N high-low ranges. The study plots a point at the current low only when the current bar has closed, Close[0] > Hprev, Ravg > 0, and (High[0]-Low[0]) >= factor × Ravg. A strict close-above comparison excludes equal highs. The indicator does not impose a volume, trend, or session filter.
Hypothetical example: five prior highs are 101, 102, 103, 102.5 and 102.8, giving Hprev = 103. Their ranges are 1.0, 1.5, 1.2, 0.8 and 1.5, so Ravg = 1.2. With factor 1.20, the new bar needs range at least 1.44. A new bar with high 104, low 102.4 and close 103.4 qualifies: its range is 1.6, its close exceeds 103, and it is final. If it touches 104 intrabar but closes 102.9, no signal should remain. These figures are schematic, not market observations.
Parameter trade-offs
| Input | Default | Research implication |
|---|---|---|
| Lookback | 5 bars | Longer windows reduce the frequency of range-high breaks but may react later. |
| MinimumRangeFactor | 1.20 | Higher values demand a more exceptional bar and may omit orderly trends. |
| Calculation gate | Closed bar | Avoids provisional intrabar marks; does not remove all live/backtest differences. |
Complete PowerLanguage .NET C# source
Create a new Indicator study in the MultiCharts .NET PowerLanguage Editor, name it ConfirmedRangeAudit, and replace its class source with the complete listing. Review the namespace and generated class template in your installed build before compilation. This code has not been compiled in the target platform; confirm API signatures and behavior locally.
using System;
using System.Drawing;
using PowerLanguage;
using PowerLanguage.Function;

namespace PowerLanguage.Indicator
{
    // Research indicator: completed-bar range expansion audit.
    public class ConfirmedRangeAudit : IndicatorObject
    {
        [Input] public int Lookback { get; set; }
        [Input] public double MinimumRangeFactor { get; set; }
        private IPlotObject signalPlot;

        public ConfirmedRangeAudit(object ctx) : base(ctx)
        {
            Lookback = 5;
            MinimumRangeFactor = 1.20;
        }

        protected override void Create()
        {
            signalPlot = AddPlot(new PlotAttributes("ConfirmedBreak", EPlotShapes.Point, Color.Green));
        }

        protected override void CalcBar()
        {
            signalPlot.Set(double.NaN);
            if (Bars.CurrentBar < Lookback + 2)
                return;
            if (Bars.Status != EBarState.Close)
                return;

            double previousHigh = double.MinValue;
            double averageRange = 0.0;
            for (int i = 1; i <= Lookback; i++)
            {
                previousHigh = Math.Max(previousHigh, Bars.High[i]);
                averageRange += Bars.High[i] - Bars.Low[i];
            }
            averageRange /= Lookback;
            double currentRange = Bars.High[0] - Bars.Low[0];
            bool breakUp = Bars.Close[0] > previousHigh;
            bool expanded = averageRange > 0.0 &&
                currentRange >= MinimumRangeFactor * averageRange;
            if (breakUp && expanded)
                signalPlot.Set(Bars.Low[0]);
        }
    }
}
Implementation notes and validation
The loop starts at index 1 deliberately. Using index 0 inside the prior-high calculation would compare the new bar with itself and make an ordinary close-above-high test impossible. The first few bars are skipped to avoid an insufficient history window. The range filter uses the current bar's high minus low, not true range or ATR; overnight gaps therefore deserve separate study. The plot resets to NaN for non-signals so the chart does not imply a continuous signal line.
- Compile in the platform's own PowerLanguage .NET editor and inspect compiler diagnostics.
- Use a small hand-constructed series to check the five-bar maximum and arithmetic mean.
- Compare a bar that briefly crosses the threshold but finishes below it with a bar that closes above it.
- Check session boundaries, missing bars, low-liquidity instruments and zero-range periods.
- Compare historical chart behavior with live updates; review whether the host's bar-state event behaves as expected for your chart type.
Failure modes and responsible use
A confirmed breakout can still fail immediately on the next bar. A larger range may indicate news-driven volatility rather than sustained demand. The study is a research marker, not a forecast or standalone trading system; it contains no entries, exits, position sizing, transaction costs or stop management. Test on representative instruments and include realistic fees and slippage before adapting the idea into execution logic. For non-time-based bars, verify close-event semantics separately.
Interested in customizing this free research indicator with session-aware filtering, alerts or additional validation? Explore our Custom Trading Software Development Services to discuss the requirements.