Inside Bars Explained: Compression, Confirmed Breakouts and Failed Signals
Inside bars are among the simplest price-action structures to identify, but they are also easy to overinterpret. A smaller candle contained within the preceding candle's entire high–low range tells us that the market has temporarily traded in a narrower range. It does not tell us which direction price will move next.
This guide explains the strict definition, a practical close-based confirmation method, and why an apparent breakout may fail. All numerical examples are hypothetical, not historical market results.
1. The exact inside-bar definition
Let Hm and Lm denote the preceding mother bar's high and low, and Hi and Li denote the following bar's high and low. Under the strict definition:
Hi < Hm AND Li > Lm
The entire second candle, including its wicks, remains inside the mother bar. Some platforms permit equality at one boundary; document which convention your analysis or backtest uses. An inside bar is not the same as an engulfing candle, which typically expands beyond the preceding body or range depending on the definition.
2. What the pattern does—and does not—mean
A mother bar establishes a local reference range. The inside bar shows range contraction relative to that one bar. This may reflect temporary balance, reduced short-term movement, or hesitation ahead of new information. It does not prove that volatility is low on a broader statistical basis, and it does not establish that large orders are accumulating.
Context changes the interpretation: inside bars near a strong trend's pullback may precede continuation; the same formation at a major resistance area may break upward briefly and reverse. Avoid treating the candle's color as a directional prediction.
3. A close-based breakout framework
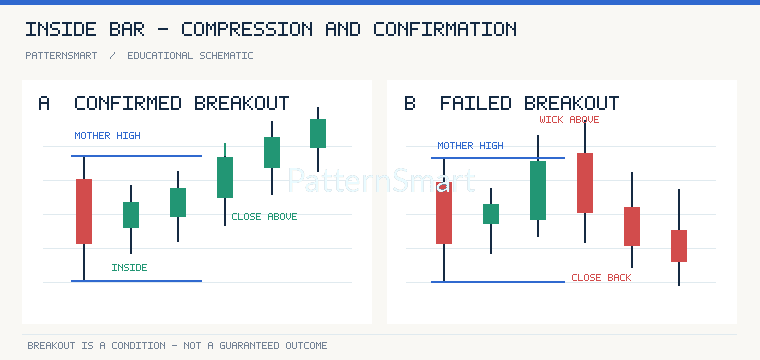
- Mark the mother range. Record its high and low after the inside bar is complete. Do not keep moving the reference to later candles without an explicit nested-pattern rule.
- Wait for a defined event. A wick crossing the mother high is a touch breakout; a completed candle closing beyond the high is a close-confirmed breakout. Neither definition is universally superior, but they produce different signals.
- Assess the follow-through. Observe whether subsequent closes hold outside the range or promptly return inside. A return into the range weakens a simple continuation thesis.
- Set invalidation and risk first. Possible invalidation references include the mother bar's opposite edge or a nearer structural level. Wider stops require smaller position sizes for a fixed monetary risk budget.
4. Worked example with hypothetical prices
| Bar | High | Low | Close | Interpretation |
|---|---|---|---|---|
| Mother | 105.00 | 99.00 | 103.00 | Reference range |
| Inside | 104.20 | 100.50 | 102.70 | Strict inside bar |
| Next A | 105.80 | 102.20 | 105.40 | Close-confirmed upside break |
| Alternative B | 105.80 | 102.20 | 103.60 | Wick-only excursion; no closing break |
In the alternative paths above, A and B are mutually exclusive possible next candles, not sequential observations. A touch-based system could trigger in both cases, whereas a close-based system triggers only in A. This distinction should be encoded explicitly in any strategy or indicator.
5. Common mistakes
- Confusing a wick with a close: a price excursion outside the range is not a closing breakout.
- Ignoring timeframes: an inside bar on a five-minute chart does not automatically carry the same context as one on a daily chart.
- Assuming a direction: contraction is a structural observation, not a bullish or bearish forecast.
- Using incomplete candles: a still-forming bar may cease to be an inside bar before it closes.
- Overlooking costs and gaps: execution can occur away from a textbook trigger; a stop order does not guarantee its requested price.
6. How to test the idea responsibly
For a fair comparison, keep the market, timeframe, costs, and sample period fixed. Compare touch-based and close-based entries, record both winners and losers, and evaluate expectancy, drawdown, trade frequency, and sensitivity to mother-bar size. Avoid using future candles to label a historical signal as if that information had been available at the decision time. Test across different market conditions and an out-of-sample period before drawing conclusions.
For traders exploring how these definitions could be implemented in a scanner or indicator, PatternSmart's Custom Trading Software Development Services covers tailored technical-analysis workflows.
Key takeaway
An inside bar is a precise description of a narrower candle range. A breakout rule, its confirmation timing, and the risk plan are separate decisions. Making those rules explicit is more useful than assuming that compression guarantees an explosive move.
Risk disclaimer: Educational material only, not personalized financial advice or a promise of trading performance. Trading involves substantial risk, including losses greater than anticipated in volatile markets.