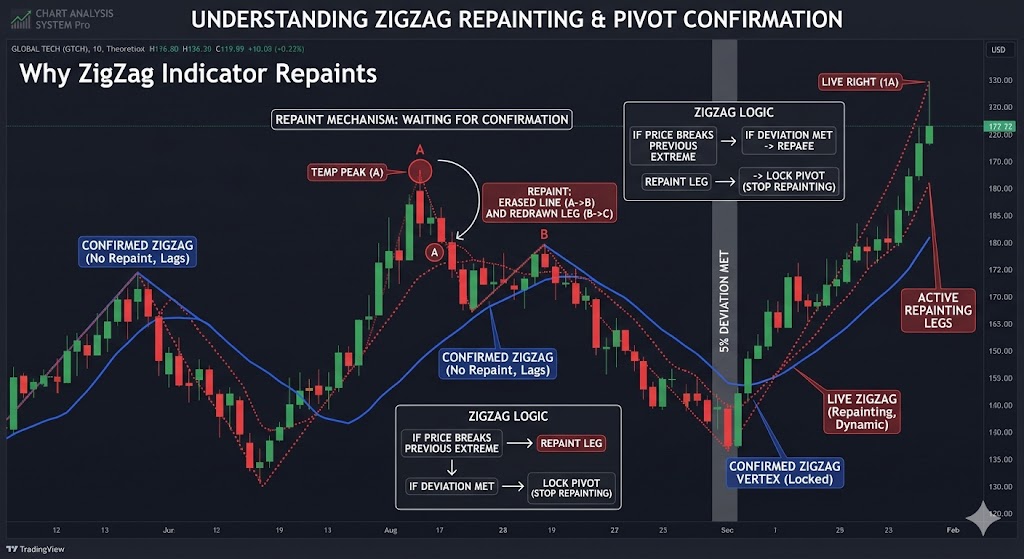
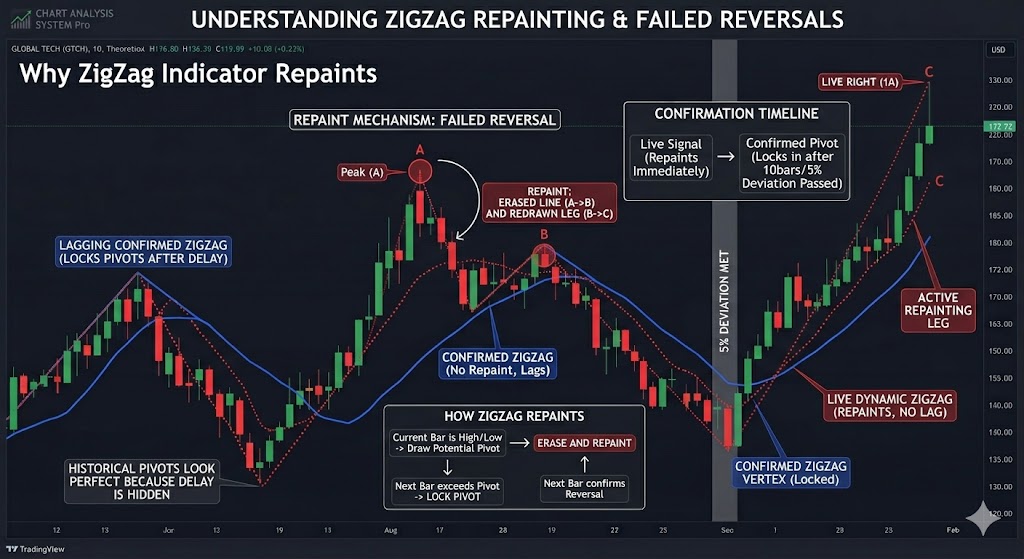
The short answer is that the ZigZag indicator repaints because it predicts the present based on the future. It is designed to filter out market noise and show major trends by connecting significant highs and lows. However, to confirm if a specific high or low is truly the “final” peak, the indicator must wait for a certain amount of price movement after that point.
The Repainting Mechanism
The indicator relies on a specific threshold, often represented as a percentage P or a fixed tick amount, to decide when to draw a new line. Until the price movement satisfies the condition ΔPrice ≥ Threshold, the most recent line remains a draft.
The Historical Illusion
On historical charts, the ZigZag looks infallible. This is because you only see the final, locked-in results. You do not see the dozens of times the lines shifted or disappeared while the bars were forming in real-time. Because of this “look-ahead” characteristic, ZigZag should never be used as a standalone entry signal.
- Market Structure: Identifying higher highs and lower lows for trend analysis.
- Harmonic Patterns: Automating the mapping of XABCD or Elliott Wave legs.
- Key Zones: Using old, locked-in peaks as reliable support and resistance levels.