Technical indicators are widely used by traders to analyze price action, identify market trends, and build systematic trading strategies. However, traders often notice that the same indicator can display slightly different values across platforms such as NinjaTrader, TradingView, MetaTrader, MultiCharts, Thinkorswim, Sierra Chart, or ProRealTime.
This does not always mean the indicator is wrong. In many cases, the difference comes from how each platform handles data, calculations, session settings, price sources, or historical bars. Understanding these differences is important for traders who compare signals across platforms or convert indicators from one platform to another.
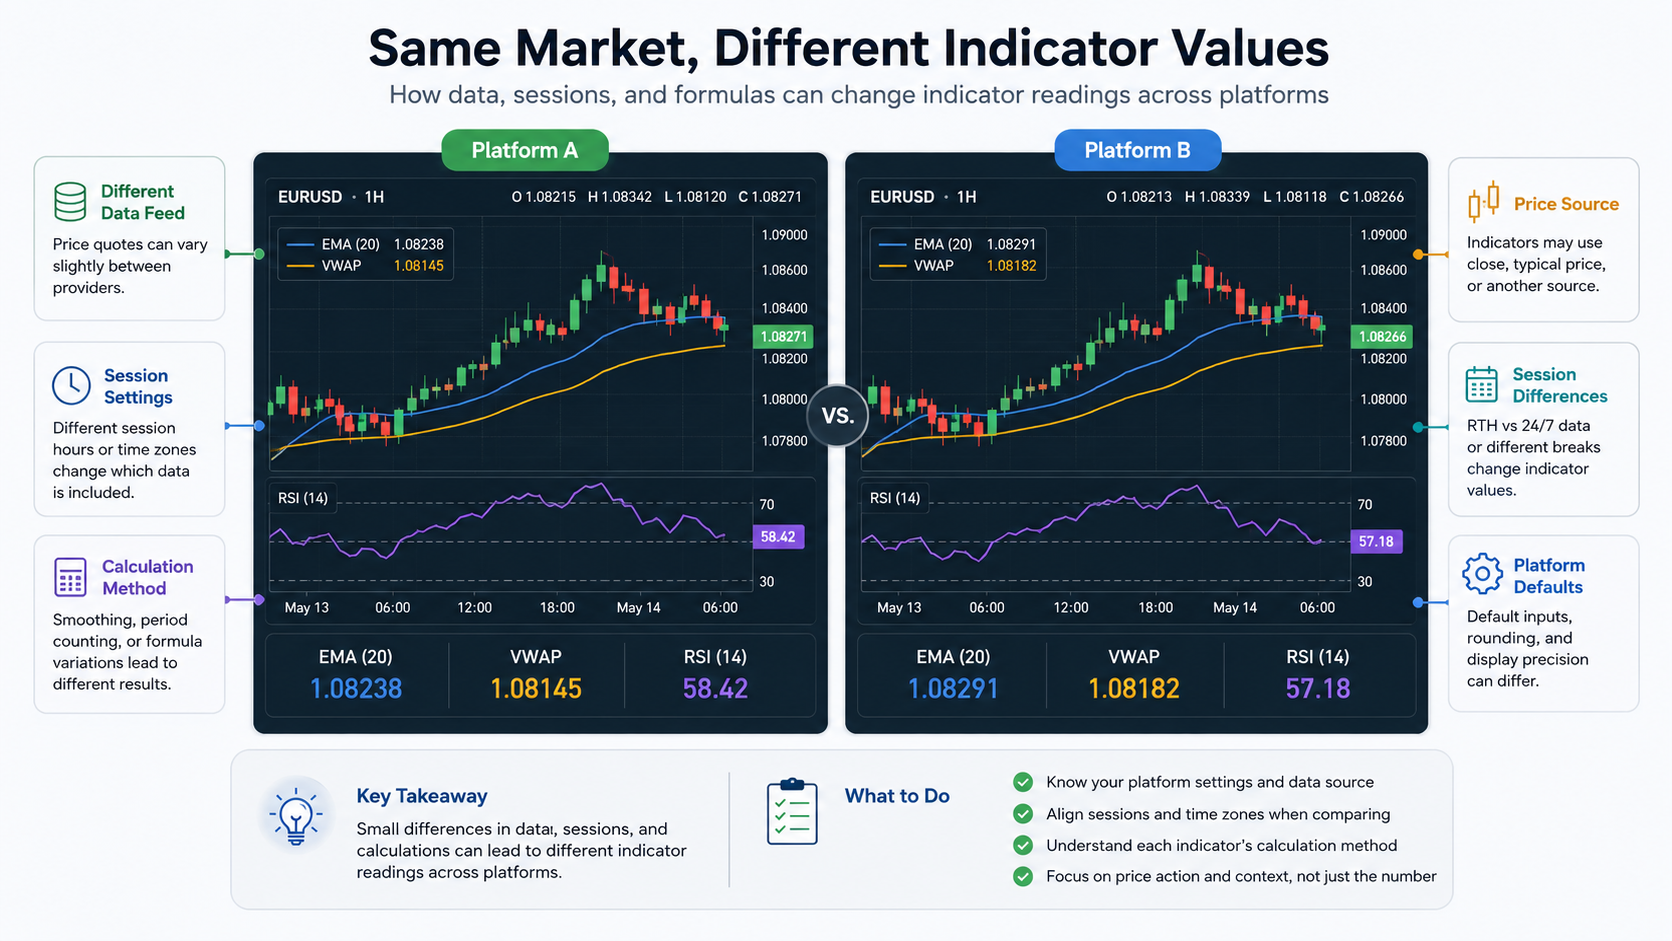
1. Different Market Data Feeds
One of the most common reasons indicator values differ across platforms is the data feed.
Even when two platforms display the same symbol, they may receive data from different providers. These data feeds can vary in bid price, ask price, last traded price, volume, timestamps, and historical corrections.
For example, a futures contract on one platform may use a professional exchange feed, while another platform may use a broker-provided or delayed feed. Small differences in historical prices can create visible differences in moving averages, oscillators, volatility bands, supply and demand zones, pivot points, or automated signals.
Indicators are calculated from price data. If the input data is different, the output values can also be different.
2. Session Templates and Trading Hours
Session settings can significantly affect indicator calculations.
Some platforms may include only regular trading hours, while others may include extended-hours or overnight data. This is especially important for futures, stocks, ETFs, and crypto markets.
Indicators such as VWAP, ATR, volume profile, pivot points, moving averages, and high-low breakout tools can produce different results depending on whether pre-market, after-hours, or overnight sessions are included.
For example, a daily VWAP calculated from the full trading session may not match a VWAP calculated from regular trading hours only. The same issue can occur with indicators that reset at the session open or rely on daily high, low, open, or close values.
3. Different Price Sources
Most indicators allow traders to choose a price source, such as close, open, high, low, typical price, median price, or weighted price.
If one platform calculates an indicator using close price and another uses typical price, the indicator values will not match. Even when the indicator name is the same, the default input source may be different across platforms.
This is common with moving averages, RSI, MACD, Bollinger Bands, Keltner Channels, and custom indicators. Before comparing indicator values, traders should confirm that both platforms use the same input price series.
4. Calculation Method Differences
Indicators with the same name may still use different formulas.
For example, one platform may use Wilder’s smoothing for RSI or ATR, while another platform may use a simple moving average, exponential moving average, or a modified smoothing method. Some platforms also use different rounding rules, initialization methods, or historical bar handling.
These differences are especially important when converting an indicator from one programming language to another. A function named ATR, RSI, EMA, or VWAP may not be calculated exactly the same way on every platform.
To make results match more closely, developers often need to recreate the full calculation manually instead of relying on built-in functions.
5. Historical Bar Initialization
Many indicators require a certain number of historical bars before they can produce stable values.
For example, a 200-period moving average needs at least 200 bars before it can calculate a complete value. Other indicators, especially those using smoothing, recursion, or cumulative calculations, may need even more bars before their values stabilize.
Different platforms may initialize these calculations differently. One platform may begin calculating as soon as enough bars are available, while another may preload additional history or use a different starting value.
As a result, two platforms may show slightly different values at the beginning of the chart, even if they eventually become very close later.
6. Bar Construction Differences
Indicators are calculated from bars, and bars are not always constructed the same way across platforms.
This is especially true for tick charts, range bars, Renko bars, volume bars, point-and-figure charts, and custom bar types. Even a small difference in how bars are built can change the open, high, low, close, and volume values of each bar.
When bar data differs, indicator values will also differ. This is why traders may see larger differences on non-time-based charts than on standard minute or daily charts.
For accurate comparison, the chart type, bar size, session template, and data source must all be aligned as closely as possible.
7. Time Zone and Timestamp Handling
Time zone settings can also affect indicator values.
If one platform uses exchange time and another uses the user’s local time zone, session boundaries may not align. This can affect indicators that reset daily, weekly, monthly, or at the beginning of a trading session.
Time-based indicators, opening range tools, VWAP, pivot levels, and multi-timeframe indicators are especially sensitive to timestamp differences.
When comparing values across platforms, make sure both charts use the same time zone and session start/end times.
8. Multi-Timeframe Calculation Differences
Multi-timeframe indicators can behave differently depending on how each platform synchronizes higher-timeframe data with lower-timeframe bars.
For example, a 15-minute moving average displayed on a 5-minute chart may update only after the 15-minute bar closes on one platform, while another platform may update it in real time as the higher-timeframe bar is forming.
This can cause temporary differences in indicator values and trading signals. It can also create confusion when backtesting, because historical charts may display completed higher-timeframe values that were not fully known in real time.
For strategy development, traders should understand whether the indicator uses closed-bar data or real-time updating higher-timeframe data.
9. Rounding and Precision Settings
Some platforms round values visually, while others use full precision internally.
For example, one platform may display an indicator value as 50.25, while another displays 50.2478. This may look like a difference, but the underlying calculation may be almost identical.
However, rounding can become important when indicator values are used in trading conditions. A signal may trigger on one platform but not another if the comparison depends on a very small decimal difference.
This is especially relevant for forex, crypto, and instruments with many decimal places.
10. Custom Code and Built-In Function Behavior
When an indicator is converted from one trading platform to another, differences in programming language and built-in functions can affect the final result.
A built-in moving average, swing high/low function, cross detection function, or standard deviation function may behave differently across platforms. Some functions use confirmed bars only, while others may update intrabar.
This is why a direct code conversion does not always produce identical results. Professional indicator conversion requires understanding both the original algorithm and the target platform’s calculation model.
How to Reduce Indicator Differences Across Platforms
To make indicator values match more closely, traders and developers should check the following:
- Use the same market data source whenever possible.
- Match the symbol, contract, and rollover settings.
- Use the same chart type and bar interval.
- Match session templates and trading hours.
- Use the same time zone.
- Confirm the same price source is selected.
- Check whether calculations use closed bars or real-time bars.
- Compare enough historical bars after the indicator has stabilized.
- Avoid relying only on platform default settings.
- Recreate formulas manually when exact matching is required.
Final Thoughts
Indicator values may differ across platforms for many legitimate reasons. The most common causes include data feed differences, session settings, price source selection, calculation methods, bar construction, timestamp handling, and built-in function behavior.
For discretionary traders, small differences may not significantly affect analysis. However, for automated strategies, signal generation, backtesting, and indicator conversion, these differences can be critical.
Before assuming an indicator is incorrect, traders should carefully compare the data, settings, and calculation logic behind each platform. A proper comparison can help identify whether the difference comes from the indicator itself or from the platform environment used to calculate it.
Understanding these details allows traders to make more accurate decisions, avoid false assumptions, and build more reliable trading tools across multiple platforms.