Multi-timeframe (MTF) indicators are highly prized by technical analysts and algorithmic traders. By overlaying data from a higher timeframe (HTF) onto a lower timeframe (LTF) chart—such as viewing a 1-hour trend indicator directly on a 5-minute execution chart—traders gain a massive advantage in maintaining perspective on the macro trend.
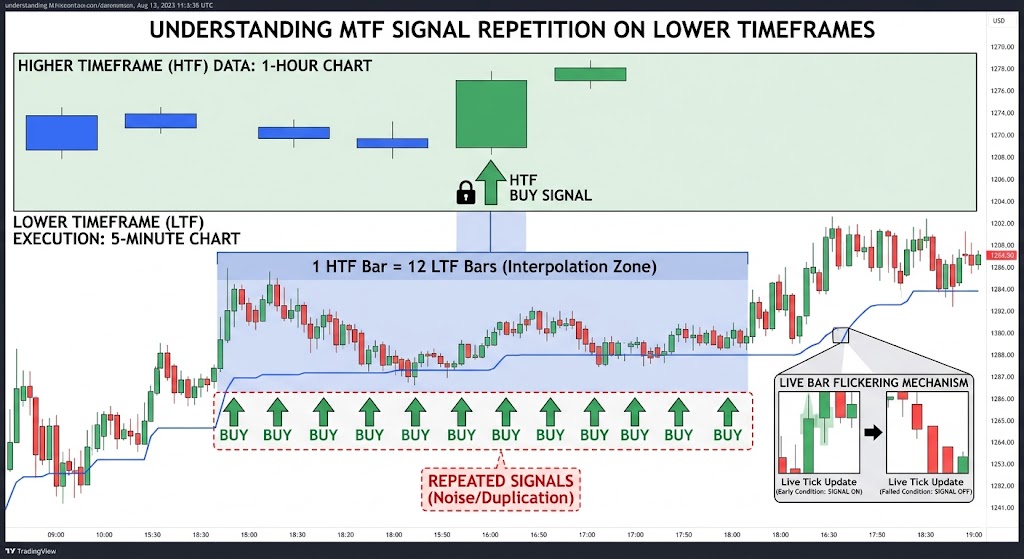
However, many developers and traders face a frustrating phenomenon when deploying MTF indicators in real-time: the appearance of repeated, duplicated, or “flickering” signals on the lower timeframe.
If you have ever wondered why an MTF indicator prints duplicate entry arrows or repeatedly triggers alerts across multiple consecutive candles, you aren’t dealing with a broken chart. You are experiencing the mechanical reality of temporal data interpolation.
Here is a deep dive into why MTF indicators show repeated signals on lower timeframes and how to optimize your trading logic to handle them.
The Core Problem: Time Resolution Asymmetry
To understand repeated signals, you have to look at how a trading platform bridges two different chart frequencies.
When an MTF indicator requests data from a higher timeframe, it treats the HTF bar as a single chunk of time. However, that single chunk is composed of multiple individual bars on your lower timeframe execution chart.
LTF Bars per HTF Bar=LTF DurationHTF Duration
For example, if you are looking at a 1-Hour HTF indicator projected onto a 5-Minute LTF chart, a single 1-hour bar contains exactly 12 five-minute bars.
[------------------------- 1-Hour HTF Bar -------------------------]
[5m][5m][5m][5m][5m][5m][5m][5m][5m][5m][5m][5m]  <-- 12 LTF Bars
Because of this asymmetry, the trading platform’s calculation engine has to make a choice on how to distribute that one HTF value across those 12 underlying LTF candles. This is where repeated signals are born.
3 Reasons Your MTF Indicator is Repeating Signals
1. Data Step-Plotting (The Value Duplication Effect)
When a platform updates an MTF indicator on a lower timeframe chart, it copies the value of the current HTF bar to every single historical LTF bar that fits inside it.
If a 1-hour indicator triggers a “Buy” condition based on its mathematical rules, that true condition is applied across the higher timeframe bar. When drawn on a 5-minute chart, your code evaluates the indicator’s state on every single 5-minute bar close. Because the 1-hour value remains identical for 12 consecutive candles, your lower timeframe strategy reads a positive signal 12 times in a row, generating a cascade of repeated signals or execution alerts.
2. Live Bar Updates and Intra-bar Flickering
During a live trading session, the current higher timeframe bar is constantly fluctuating.
Using our example, during the full hour, the 1-hour candle is continuously moving up and down. If the HTF indicator triggers a signal ten minutes into the hour, your 5-minute chart will print a signal. If the market reverses five minutes later, the HTF condition may turn false, causing the signal on the current 5-minute bar to vanish. If it returns down the line, it prints again.
This creates an illusion of multiple, repeated, unstable signals because the underlying parent candle hasn’t locked in its final close yet.
3. Look-Ahead Bias in Backtesting vs. Live Trading
A major pitfall in MTF script writing is referencing unclosed HTF bars without an offset.
- In a Backtest: The engine knows exactly how the 1-hour candle closed, and it perfectly maps that final state backward to all 12 of the 5-minute candles. It looks like a beautiful, continuous signal.
- In Live Trading: The engine doesn’t know the future. It updates the signal dynamically on every 5-minute bar.
This mismatch causes severe discrepancies where live execution reveals repetitive, looping signals that never appeared during historical backtests.
How to Fix and Prevent Repeated MTF Signals in Code
If you are developing proprietary trading tools or indicators, you can eliminate duplicated signals by implementing structured historical indexing.
Shift to “Closed Bar” Indexing (The One-Bar Offset)
To prevent repeated signals from shifting dynamically or firing continuously on the current live bar, always force your MTF logic to fetch data from the previously closed higher timeframe bar.
- The Repainting/Repeating Method: Fetching the current, unclosed HTF value (Index
0). - The Stable Method: Fetching the completed, locked-in HTF value (Index
1).
By referencing Index 1 of the higher timeframe, the indicator value will remain perfectly static and locked across all 12 of the lower timeframe bars. It will only update to a new value once the current hour fully closes, ensuring a signal fires exactly once per cycle.
Implement a Signal Latch (State Machine)
If you must use live intra-bar MTF data for early entries, you should code a logical “latch” or state tracking variable to prevent duplicate execution:
Python
# Conceptual state machine to prevent repeated signals
has_fired_this_cycle = False

if new_htf_bar_started:
    has_fired_this_cycle = False # Reset latch on a new HTF bar

if mtf_signal_condition == True and not has_fired_this_cycle:
    execute_trade_signal()
    has_fired_this_cycle = True  # Lock the latch until the next HTF bar
Conclusion
Repeated signals on lower timeframes are a natural structural byproduct of multi-timeframe analysis. They occur because a single macro data point naturally blankets multiple micro bars. By understanding how your platform maps higher timeframe data down to your execution charts—and adjusting your scripts to reference closed bars or utilize signal tracking latches—you can eliminate noise, clean up your charts, and build significantly more reliable algorithmic strategies.