In the world of technical analysis, the Moving Average (MA) crossover is often one of the first strategies a trader learns. Whether it’s the “Golden Cross” (the 50-day crossing above the 200-day) or a fast-paced 9/21 EMA scalp, the logic is intuitively appealing: when a short-term trend overtakes a long-term trend, momentum is shifting.
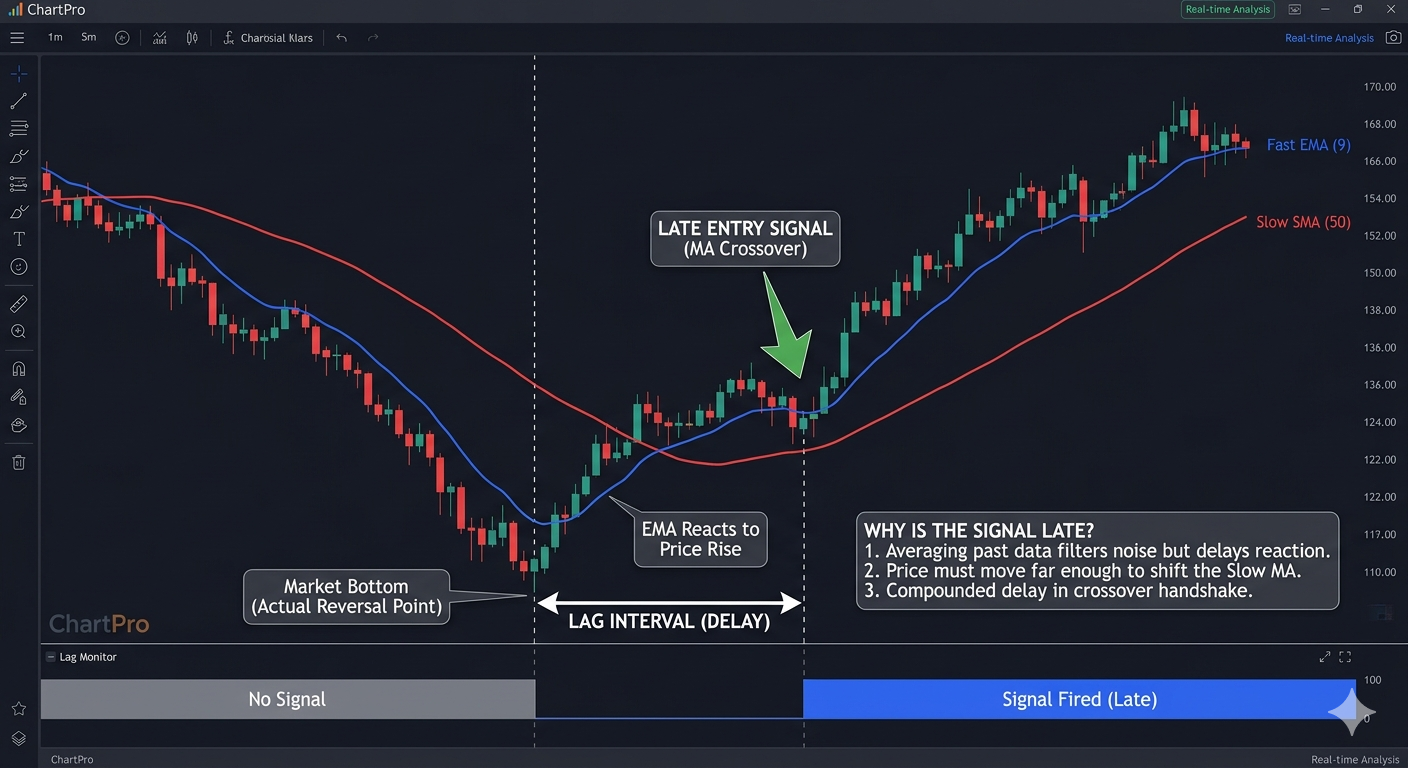
However, many traders quickly encounter a frustrating reality: by the time the crossover actually appears on the chart, a significant portion of the price move has already occurred. This phenomenon is known as Lag, and it is a fundamental characteristic of all trend-following indicators.
Here is an analysis of why moving average crossovers are inherently “late” and how professional traders manage this structural delay.
1. The Mathematical Anchor: Averaging the Past
The primary reason for late signals is found in the formula itself. A moving average is a lagging indicator because it is a calculation based on historical price data.
When you calculate a 50-period simple moving average (SMA), you are summing the closing prices of the last 50 candles and dividing by 50. This means the current value of the moving average is anchored to data points from the past. For a crossover to occur, the new price action must be strong enough to significantly move that historical average.
2. The “Filter” Paradox
Moving averages are designed to be “noise filters.” They smooth out erratic price fluctuations to reveal the underlying trend. However, there is a direct trade-off between smoothness and responsiveness:
- Higher Smoothing: Using a longer period (like a 200 SMA) creates a very smooth line that ignores minor price spikes but takes a long time to react to a true trend change.
- Lower Smoothing: Using a shorter period (like a 5 EMA) reacts quickly to price but produces “whipsaws”—false signals caused by minor market noise.
Because a crossover requires two averages to move, the delay is compounded. The shorter average must react, and it must move far enough to bypass the even slower, longer-term average. By the time this mathematical “handshake” happens, the market has usually already spent a great deal of its directional energy.
3. High Volatility vs. Low Volatility
The “lateness” of a signal is often exacerbated by the speed of the market.
- V-Shaped Recoveries: In a sharp, high-volatility reversal, price moves so fast that the averages cannot catch up. The crossover may finally occur just as the market is becoming overbought and due for a pullback.
- Grinding Trends: In slow, steady trends, crossovers perform better. However, even then, the entry is rarely at the “bottom,” as the averages require a confirmed trend established over several bars before they cross.
Strategies to Mitigate Signal Lag
While you cannot eliminate lag entirely, you can optimize your strategy to account for it:
A. Use Exponential Moving Averages (EMA)
Unlike the Simple Moving Average (SMA), which weights all data points equally, the EMA places more weight on the most recent price data. This makes the EMA more responsive to sudden price shifts, resulting in slightly “faster” crossovers.
B. Combine with Leading Indicators
To “front-run” a crossover, professional traders often look for leading indicators like RSI Divergence or Volume Spikes. If you see bullish divergence on the RSI while price is still below the moving averages, it serves as an early warning that a crossover is likely imminent.
C. Reference Market Structure
Instead of waiting for the crossover to trigger an entry, use the crossover to define the bias. Once the averages cross, wait for a “pullback and retest” of the moving average line. This allows you to enter at a better price point rather than “chasing” the late signal.
Conclusion
Moving average crossovers are not “broken”; they are simply doing exactly what they were designed to do: confirm a trend that has already begun. By understanding that a crossover is a tool for confirmation rather than prediction, traders can avoid the trap of chasing late entries and instead build strategies that respect the mathematical reality of lag.