The Double Divergence Indicator is available in multiple specialized versions, including ADX, CCI, DMI, MACD, Momentum, Money Flow, RSI, RVI, Stochastics, and Williams %R, allowing traders to analyze divergences from different market perspectives.
To accommodate a wide range of trading environments, the Double Divergence Indicator is supported across several leading platforms, including cTrader, MetaTrader 4 (MT4), MetaTrader 5 (MT5), NinjaTrader 8, MultiCharts, MultiCharts .NET, ProRealTime, and Sierra Chart.
This manual details the configurable control variables for the Double Div Pro institutional-grade multi-layered divergence indicator. By understanding how these parameters alter the underlying chart logic and execution dynamics, traders can systematically optimize the system for specific market regimes, asset classes, and timeframes while managing the trade-offs between signal frequency and statistical reliability.
Wait 1 bar
- Default Value: True
- Chart Logic: Controls the execution window and confirmation delay. When enabled (
True), a bullish signal is only finalized and plotted on the historical bar if the current execution bar closes with an upward bias (Close≥Open) ; conversely, a bearish signal requires a downward close (Close≤Open). When disabled (False), signals are registered instantly upon structural divergence fulfillment without candle directional validation. - Trading Strategy & Trade-offs:
- Enabling (
True): Reduces execution slippage and protects against catching a “falling knife” during aggressive, one-directional momentum moves. It introduces a 1-bar lag but ensures that price action has begun to stabilize in the direction of the divergence before a trade is triggered. Highly reliable in volatile or trending environments. - Disabling (
False): Minimizes entry lag, allowing aggressive mean-reversion traders to execute at the absolute extreme edges of a structural swing. However, it exposes the strategy to significant market noise, whipsaws, and false breakouts if the counter-trend momentum persists through the close of the bar. - Core Trading Recommendation: Keep enabled (
True) for day trading and swing trading on equities or crypto to filter out high-volatility stop-outs. Scalpers utilizing highly liquid, micro-timeframe charts (e.g., 1-minute or tick charts) may disable this feature to capture immediate alpha, provided they pair it with rigid manual risk management.
- Enabling (
Show Regular Bullish / Show Regular Bearish
- Default Value: True
- Chart Logic: Toggles the calculation and visual presentation of regular structural divergence signals. Regular bullish divergence prints an automated marker when price registers a lower low while the underlying momentum index forms a higher low. Regular bearish divergence prints when price establishes a higher high but momentum registers a lower high.
- Trading Strategy & Trade-offs:
- Activating (
True): Arms the system to detect major macroeconomic or microstructural market reversals. Increasing focus on these inputs allows traders to capture major swing failure patterns (SFPs) and institutional liquidity sweeps at extreme structural boundaries. - Deactivating (
False): Cleanses the chart of counter-trend signals. Deactivating regular divergence is ideal when a market is locked into a powerful macro-trend, where attempting to guess the absolute top or bottom results in compounding losses due to persistent trend extension. - Core Trading Recommendation: Keep active when trading ranging, mean-reverting, or cyclically rotating markets. If deploying this tool on an index or stock experiencing an unhedged trend expansion, deactivate regular signals and focus exclusively on continuation patterns.
- Activating (
Show Hidden Bullish / Show Hidden Bearish
- Default Value: True
- Chart Logic: Controls the visibility and computation of trend-continuation divergence signals. Hidden bullish divergence maps a higher structural price low against a lower momentum low, indicating a deep momentum reset within an overarching uptrend. Hidden bearish divergence maps a lower price high against a higher momentum high, signaling a momentum reload within a broader downtrend.
- Trading Strategy & Trade-offs:
- Activating (
True): Provides a continuous stream of low-risk, high-reward entries aligned with the dominant order flow. It excels at identifying the exact termination points of corrective pullbacks (buying the dip or selling the rip). - Deactivating (
False): Limits the system exclusively to catching market tops and bottoms. Turning these off during a strong trend prevents the trader from participating in momentum pullbacks, drastically reducing trade frequency in highly liquid, trending environments. - Core Trading Recommendation: Essential for trend-following strategies and swing traders operating on higher timeframes (e.g., 4-Hour or Daily). Hidden divergence typically offers a significantly higher win rate than regular divergence because it executes in alignment with the institutional macro-path of least resistance.
- Activating (
Enhanced Mode
- Default Value: False
- Chart Logic: Applies a secondary, strict structural slope filter to the twin historical anchor peaks or troughs. When activated, it invalidates and suppresses regular or hidden signals if the internal geometry between the first and second historical swing points fails to maintain a specific directional trajectory.
- Trading Strategy & Trade-offs:
- Enabling (
True): Drastically tightens the statistical filter, leading to a massive drop in overall signal frequency. The signals that do pass through exhibit an exceptionally high probability of success, making this mode ideal for high-conviction, large-size executions. It effectively eliminates marginal or “ugly” patterns. - Disabling (
False): Operates on standard sequential divergence parameters, maximizing opportunity capture across all variations of double divergence structures. The trade-off is a heightened vulnerability to over-fitting, where minor structural micro-twists can generate false positives in choppy, sideways markets. - Core Trading Recommendation: Enable (
True) if you are managing automated trading systems or multi-asset prop-firm accounts where drawdowns must be kept at strict minimums. Keep disabled (False) for active discretionary manual trading where you can visually filter out poor market context yourself.
- Enabling (
Enable Alert
- Default Value: True
- Chart Logic: Activates the real-time event listener and programmatic notification engine. When a double divergence structure is confirmed at the close of a bar, this variable dictates whether a high-priority system flag is raised.
- Trading Strategy & Trade-offs:
- Enabling (
True): Maximizes execution efficiency and situational awareness across multiple watchlists. It removes the need for constant, fatigue-inducing screen monitoring, allowing traders to execute on setups instantly upon structural confirmation. - Disabling (
False): Silences the technical environment, removing automated prompts. While it eliminates repetitive auditory distractions during choppy market regimes, it introduces substantial execution risk, as traders will inevitably miss fleeting trading windows on non-anchored charts. - Core Trading Recommendation: Always keep active (
True) in live production environments. Ensure it is coupled with an optimized timeframe so alerts correspond to real execution intent rather than micro-noise.
- Enabling (
Alert sound
- Default Value: Alert1.wav
- Chart Logic: Directs the program to pull a specific audio file from the native terminal sounds directory upon signal generation.
- Trading Strategy & Trade-offs:
- Customization: Allows the architect to assign unique auditory profiles to different assets or signal classes (e.g., a distinct sound for regular reversals vs. hidden continuations).
- Risk Management: Prevents cognitive overload by allowing a trader to instantly recognize the exact class and direction of an incoming signal through sound alone, improving reaction speed during fast-moving market open sessions.
- Core Trading Recommendation: Assign sharper, high-frequency alerts to counter-trend regular signals (which require immediate tactical attention) and softer, ambient alerts to trend-continuation hidden signals.
Show Char
- Default Value: True
- Chart Logic: Aligns the chart typography to print clear text abbreviations (“R” for Regular, “H” for Hidden) instead of basic geometric shapes beneath the confirmed bar.
- Trading Strategy & Trade-offs:
- Enabling (
True): Significantly improves the scannability of a multi-timeframe desktop setup. It instantly informs the trader of the exact setup classification without requiring them to reference a complex indicator color legend. - Disabling (
False): Reverts the visual engine to standard dots if typographic rendering ever fails. This minimizes chart clutter on ultra-dense, historical data-heavy layouts. - Core Trading Recommendation: Highly recommended for discretionary traders running multi-asset screens where rapid visual parsing prevents execution delay.
- Enabling (
Show Line
- Default Value: True
- Chart Logic: Governs the dynamic drawing engine that projects structural trendlines directly across the local price extremes (highs/lows) and the corresponding momentum indicator values. It visually links the current confirmation bar back to the two prior historical validation points.
- Trading Strategy & Trade-offs:
- Enabling (
True): Provides a complete historical map of the trade’s structural integrity. It exposes the slope and symmetry of the double divergence, giving the trader immediate visual confirmation of the pattern’s validity and clean anchor boundaries. - Disabling (
False): Strips all trendlines, leaving only the signal plot symbols on the screen. This drastically reduces chart noise, making it perfect for traders who stack multiple indicators (e.g., VWAP, Moving Averages, volume profiles) on a single workspace. - Core Trading Recommendation: Keep enabled (
True) during retrospective backtesting and strategy optimization to ensure the swing boundaries align perfectly with your chart logic. Disable it in live trading execution screens if your workspace is already crowded with structural levels.
- Enabling (
Only Show Last Signal Within Bars
- Default Value: 10
- Chart Logic: Operates as an automated cleanup filter that dynamically manages chart clutter. If a new double divergence signal fires within this specified number of bars from a previous signal of the same category, the system completely erases the historical lines and shapes associated with the older signal, preserving only the newest instance.
- Trading Strategy & Trade-offs:
- Increasing This Value: Aggressively clears out historical data over a wider lookback area. This ensures that only the most fresh, structurally relevant execution zone is displayed on your screen, preventing “phantom entries” based on outdated market structures.
- Decreasing/Zeroing This Value: Allows the indicator to retain all historical signal lines across the chart. While this creates a messy visual environment in consolidating or ranging markets, it provides a highly accurate historical map for backtesting, showing exactly how often clusters of signals tend to form.
- Core Trading Recommendation: Maintain a lower value (or 0) on historical backtesting profiles to thoroughly audit indicator clustering behavior. Raise this value to 10–20 on live execution screens to ensure a perfectly clean workspace that is free of redundant, obsolete drawings.
Price Line 1 Brush / Price Line 2 Brush
- Default Value: Orange / Lime
- Chart Logic: Controls the visual coloring of the structural trendlines connecting the current bar to the first swing point (Line 1) and the first swing point to the second swing point (Line 2).
- Trading Strategy & Trade-offs:
- Visual Hierarchy: Essential for instantly distinguishing between short-range micro-swings and long-range macro-boundaries.
- Core Trading Recommendation: Customize these brushes to match your workspace background style. For example, use hot, contrasting colors for short-range momentum shifts, and muted, pastel shades for long-range, institutional trend changes.
Price Line Dash Style
- Default Value: Solid
- Chart Logic: Dictates the visual texture (Solid, Dash, Dot) of the lines connecting structural price extremes.
- Trading Strategy & Trade-offs:
- Chart Management: Helps separate active, ongoing structural patterns from historic or broken technical setups.
- Core Trading Recommendation: Use solid lines for high-conviction regular reversal signals and dashed configurations for continuation signals to maintain a clean visual hierarchy.
Price Line Width
- Default Value: 1
- Chart Logic: Adjusts the thickness of the printed trendlines on the price panel.
- Trading Strategy & Trade-offs:
- Visual Prioritization: Prevents structural anchor lines from overwhelming the underlying candlesticks or price action.
- Core Trading Recommendation: Keep thin (1 or 2) on high-density charts. Increase thickness (3 or 4) only when trading macro higher-timeframe charts (e.g., Weekly/Monthly) where a confirmed signal carries heavy structural significance.
Divergence Bar Range
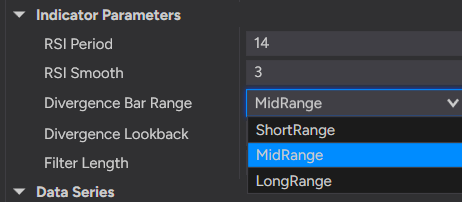
- Default Value: ShortRange
- Chart Logic: Defines the internal boundaries for the swing engine, dictating the minimum and maximum distance allowed between historical anchor points. It operates via three structural settings:
- ShortRange: Captures tight, immediate micro-swing structures to identify swift momentum shifts within localized price consolidations.
- MidRange: Filters for standard, intermediate swing structures to capture classic market swings and standard daily cycles.
- LongRange: Locks onto major macro-structural peaks and troughs, allowing the system to isolate foundational trend-reversal zones across extended time horizons.
- Trading Strategy & Trade-offs:
- Scaling Up (
LongRange): Tracks major institutional market turns and key swing failures across significant time horizons. Signal frequency drops substantially, but the macro reliability and risk-to-reward potential of each signal increase dramatically. Perfect for macro trend reversals. - Scaling Down (
ShortRange): Captures high-frequency micro-divergences within local consolidations. This provides rapid trade opportunities, but exposes the trader to sharp whipsaws when a market breaks out into a strong, sustained trend. - Core Trading Recommendation: Match this parameter directly to your trading style: Use
ShortRangefor fast-paced intraday scalping ,MidRangefor standard intraday day trading , andLongRangefor multi-day swing trading positions.
- Scaling Up (
Divergence Lookback
- Default Value: 5
- Chart Logic: Controls the lookback window used by the local extreme calculation engine to identify valid swing peaks and troughs.
- Trading Strategy & Trade-offs:
- Increasing This Value: Requires the market to sustain a swing high or low over a longer duration before it is accepted as a valid anchor point. This ensures that signals are only drawn from major, undeniable chart structures, drastically lowering false positives. The downside is increased signal lag.
- Decreasing This Value: Allows the engine to lock onto quick, nimble pivot points. While this gives you early entries at potential turning points, it frequently misinterprets minor, noise-driven consolidations as significant double divergence structures.
- Core Trading Recommendation: Keep this perfectly balanced between 5 and 8. If you find yourself getting caught in multiple false breakouts during low-volatility market sessions, increase this setting to force the indicator to hunt for more significant structural anchors.
Filter Length
- Default Value: 5
- Chart Logic: Sets the smoothing period for the baseline tracking moving average. The indicator logic uses this average to confirm that momentum values are properly positioned above or below the baseline before a signal is finalized.
- Trading Strategy & Trade-offs:
- Increasing This Value: Creates a much more conservative, lag-resistant validation filter. It requires a clear, sustained breakout away from the baseline average to validate a signal, protecting you from entering trades during flat, choppy periods.
- Decreasing This Value: Pulls the validation baseline tight against the momentum line, resulting in highly sensitive and frequent signal generation. The risk is that the system will trigger signals during minor counter-trend pullbacks that lack real institutional volume or follow-through.
- Core Trading Recommendation: Align this parameter with your chosen indicator Period input such as RSI. If you are utilizing a faster, more sensitive RSI setting (e.g., 9), scale down the filter length to 3 to maintain a nimble system. If running a slow macro RSI (e.g., 21), scale the filter length up to 8 or 10 to ensure clean, smooth confirmations.