Manual divergence hunting can be exhaustive, prone to subjectivity, and frequently disrupted by market noise. The RSI Double Divergence indicator for NinjaTrader 8 automates this process by scanning for back-to-back, continuous divergence patterns between price action and momentum. By identifying two consecutive divergence points relative to historical swing peaks, this institutional-grade tool provides traders with highly reliable, multi-layered structural confirmations before a trend reverses or continues.
2. Key Features
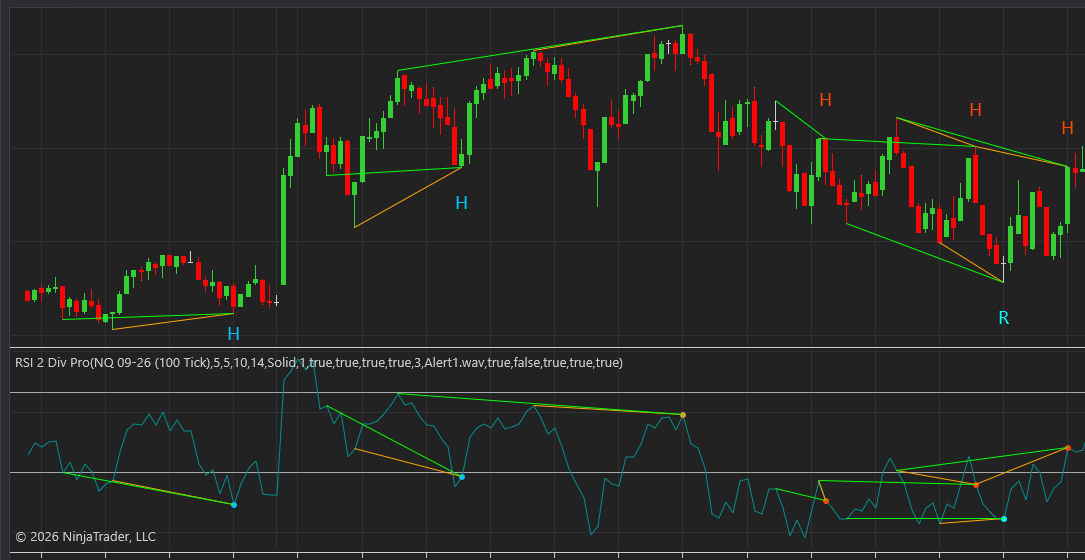
The RSI Double Divergence indicator seamlessly integrates complex multi-period swing analysis into a clean, actionable visual interface.
- Dual-Layer Signal Confirmation: Unlike standard single-divergence tools, this indicator triggers only when two sequential divergence structures line up against previous swing points, giving you far more reassuring and precise trend signals.
- Comprehensive Pattern Detection: Tracks and isolates four distinct market states simultaneously:
- Regular Bullish / Bearish: For spotting high-probability trend reversals.
- Hidden Bullish / Bearish: For identifying strong trend continuation entries.
- Intuitive Visual Blueprint: Draws clean, color-coded trendlines directly on both your price panel and the RSI oscillator pane to connect the corresponding peaks and troughs automatically.
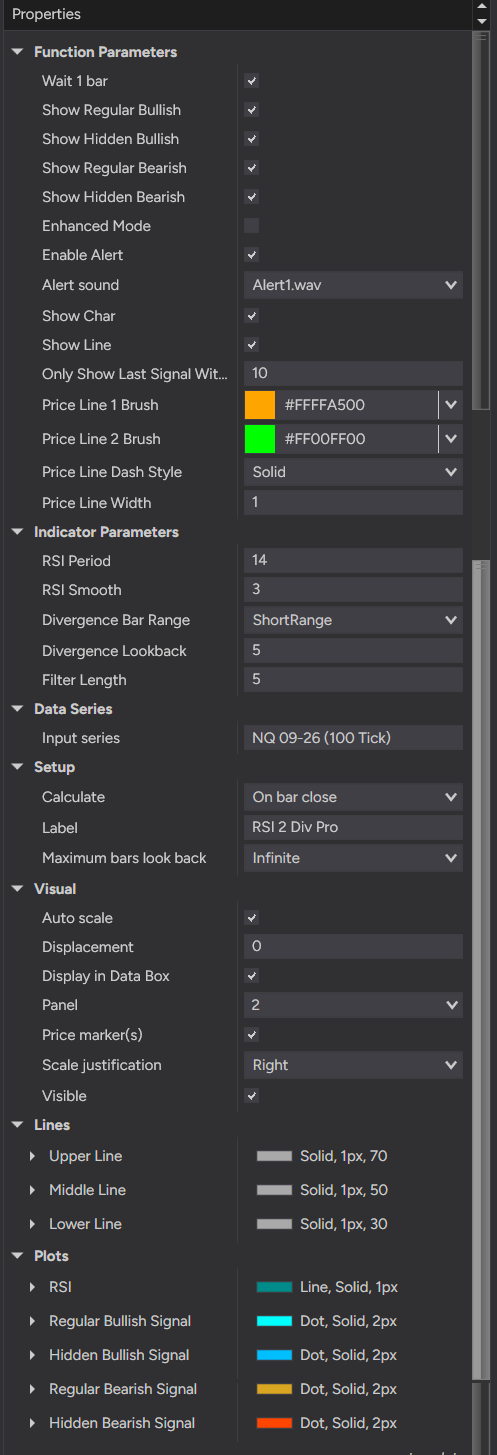
- Smart Signal Management: Includes an automated lookback filter (“Only Show Last Signal Within Bars”) that cleans up the chart by removing older, redundant signals of the same type as new ones form.
- Customizable Alert System: Supports real-time audio (.wav) notifications and visual alerts, ensuring you never miss a confirmed setup even when managing multiple charts.
- Fully Adjustable Parameters: Tailor the tool to your trading style by tweaking the RSI smoothing periods, choosing between short, mid, or long-range swing lookbacks, or enabling a conservative “Wait 1 Bar” confirmation rule.
3. How to Use It / Trading Strategy
Incorporating the RSI Double Divergence indicator into your daily trading routine is straightforward, whether you are a scalper, day trader, or swing trader.
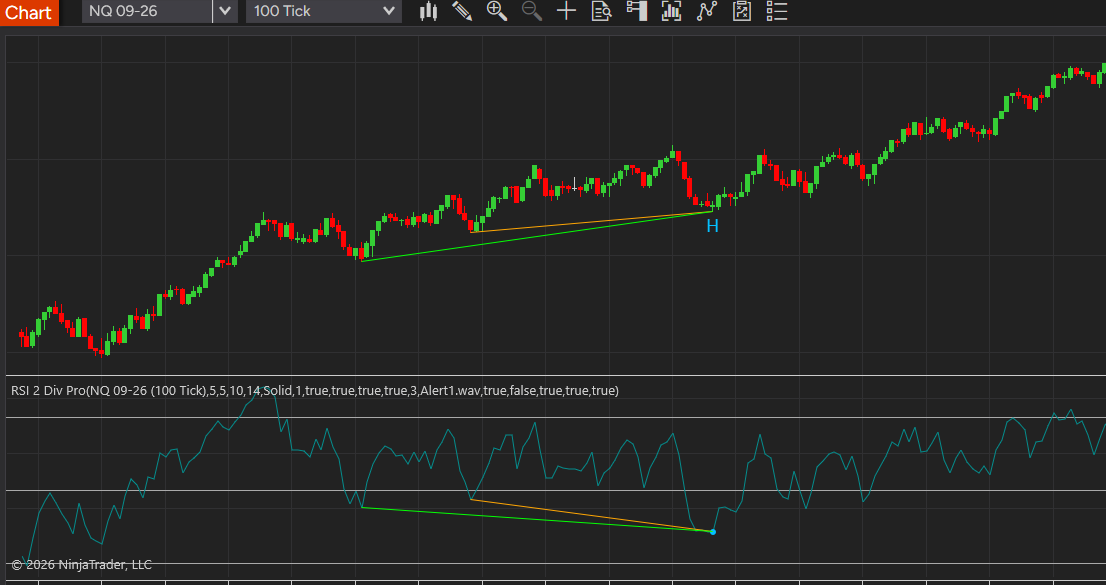
- Trading Reversals (Regular Divergence): When the indicator plots two consecutive regular bullish divergence lines, it indicates that while price is making lower lows, downside momentum is drying up. Look for a confirmed “R” dot/character to print under the candle as your cue to anticipate a bullish reversal.
- Trading Continuations (Hidden Divergence): During an established uptreend, if price pulls back and forms a higher low while the RSI makes a double lower low, the indicator will print a hidden bullish signal (“H”). This confirms that momentum has reset lower while price held its structure, offering a low-risk entry to buy the dip.
- The “Wait 1 Bar” Confirmation: For a safer approach, enable the built-in candle confirmation feature. This ensures a bullish signal is only finalized if the trigger bar closes green (or a bearish signal closes red), adding an extra layer of price-action validation to your execution.
4. Why Choose This Tool
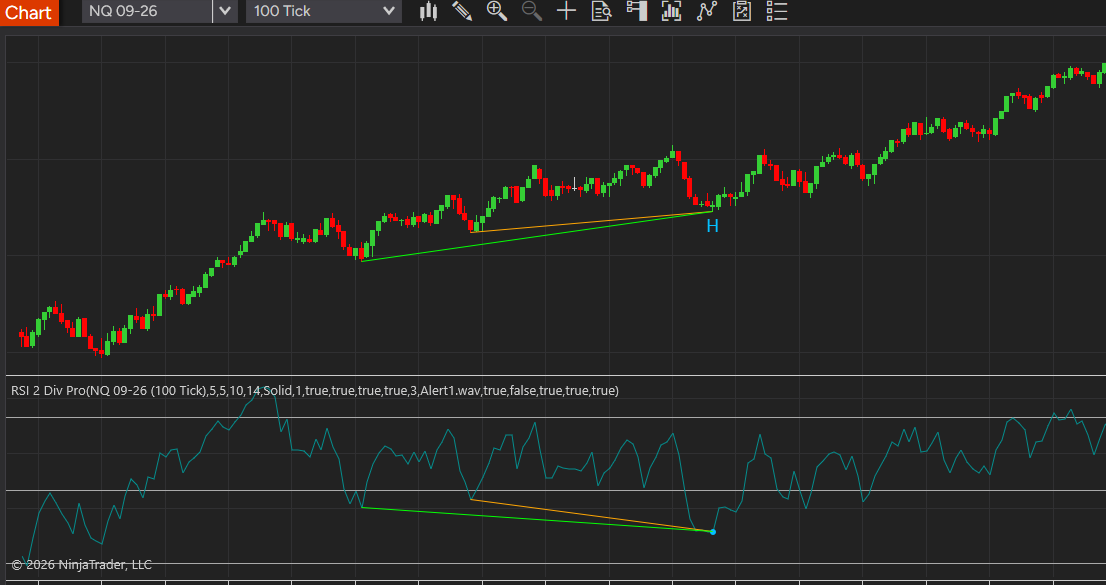
In trading, consistency is everything. The RSI Double Divergence indicator removes the emotional bias and manual guesswork of drawing trendlines, replacing it with rigid, automated mathematical precision. Built from the ground up specifically for NinjaTrader 8, it runs natively with infinite lookback capabilities without lagging your charts. By upgrading from single-layer signals to sequential “double” confirmations, you effectively filter out the market fakeouts that trap retail traders—giving you a sharper, more objective edge every time you step up to the screens.
Technical Inputs Manual: RSI 2 Div Pro (NinjaTrader 8)
This manual details the configurable control variables for the RSI 2 Div Pro institutional-grade multi-layered divergence indicator. Please visit Technical Inputs Manual: Double Div Pro for more details.
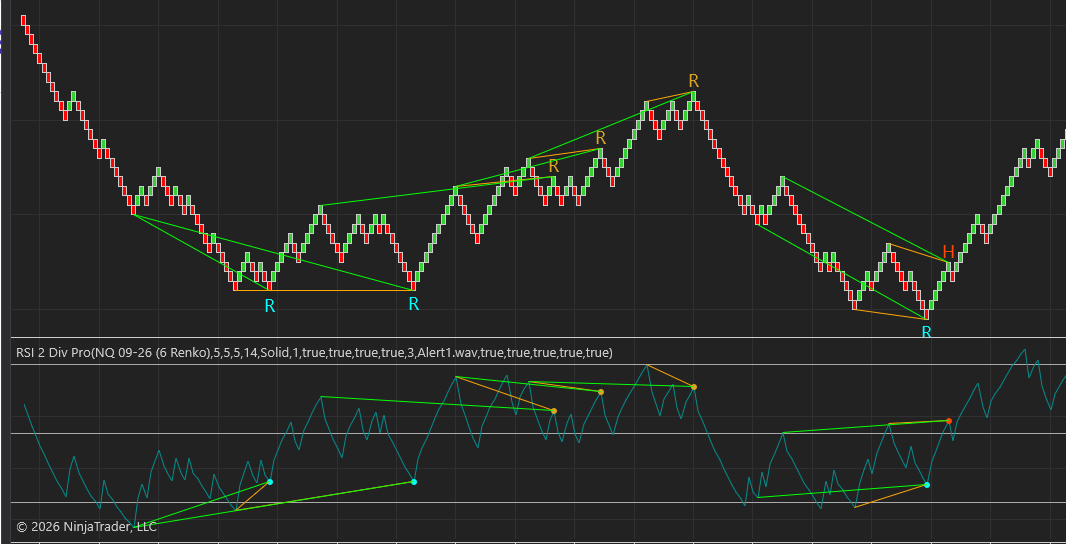
Universal Charting Adaptability
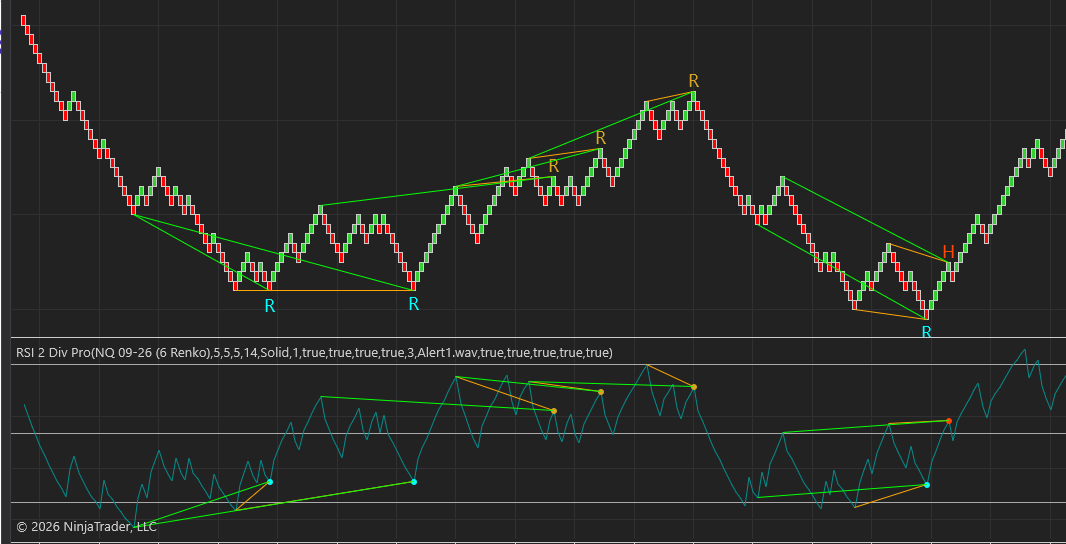
A core strength of the RSI Double Divergence indicator is its algorithmic flexibility. It is completely independent of standard time formatting, meaning its pattern-detection engine operates flawlessly across all major chart types supported by the platform. As shown in the image
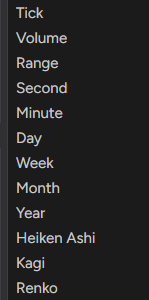
, the tool seamlessly adapts to your specific analytical framework:
- Intraday & Momentum Charts: Capture lightning-fast institutional shifts on Tick, Volume, Range, and Second charts, filtering out pure time-based noise to focus on raw order flow velocity.
- Traditional Time-Based Intervals: Conduct classic technical analysis across standard macro horizons, including Minute, Day, Week, Month, and Year intervals.
- Advanced Price-Action Styles: Maximize trend-filtering capabilities by running the indicator on smoothed or structural chart geometries like Heiken Ashi, Kagi, and Renko.
Whether you are scalping micro-swings on high-frequency volume bars or tracking multi-month macro-structural shifts, the logic scales universally to ensure consistent, precision-drawn setups on any canvas you choose.