The Chart Pattern Rectangle for TradingView is a specialized chart pattern recognition indicator designed to help traders identify rectangle consolidation patterns directly on their TradingView charts.
Rectangle patterns occur when price trades within a relatively defined upper and lower range, creating a period of consolidation between opposing price boundaries. Instead of requiring traders to manually inspect historical price swings and draw horizontal levels, the indicator automatically identifies qualifying rectangle structures and presents them directly on the chart.
The indicator also provides bullish and bearish breakout detection, making it useful for traders who study consolidation, range development, and potential price expansion.
Whether you trade stocks, futures, forex, cryptocurrencies, or other TradingView-supported markets, Chart Pattern Rectangle provides a structured visual approach to monitoring rectangle formations and their subsequent breakouts.
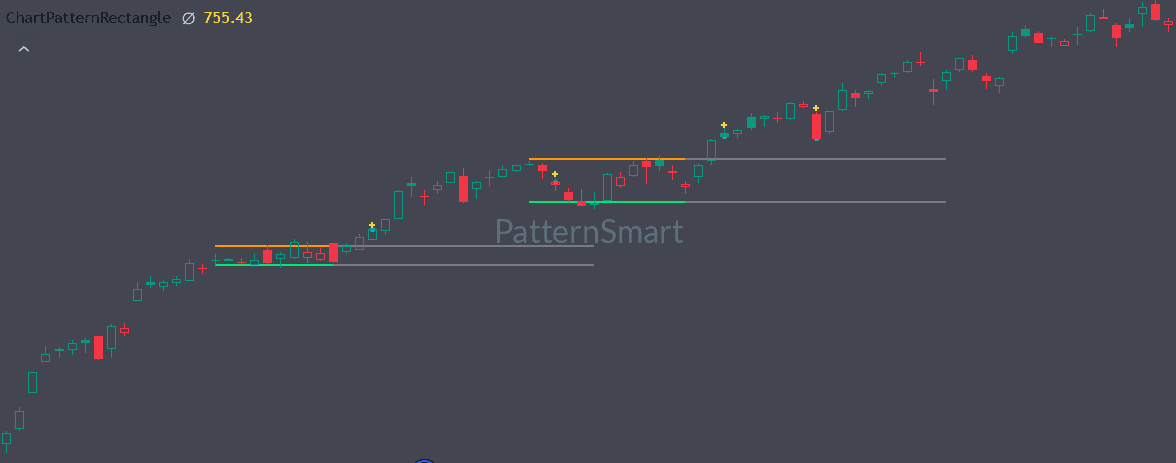
What Is a Rectangle Chart Pattern?
A rectangle pattern is a market structure in which price repeatedly interacts with an upper resistance area and a lower support area while remaining within a relatively horizontal trading range.
Visually, the pattern resembles a rectangle:
- Upper boundary: represents the upper price area of the consolidation.
- Lower boundary: represents the lower price area.
- Internal price action: remains contained within the defined range.
- Breakout: occurs when price moves beyond one of the established boundaries.
Rectangle formations can appear during pauses in an existing trend or during broader periods of market consolidation.
For traders, recognizing the structure can provide useful context for understanding where price has established a temporary range and where a potential expansion may occur.
Automated Rectangle Pattern Detection
Manually identifying rectangles can require repeated examination of swing highs, swing lows, and the relationship between multiple price points.
Chart Pattern Rectangle automates this process.
The indicator evaluates potential price structures and looks for qualifying upper and lower boundaries. A rectangle is only recognized when the required structural conditions are satisfied, helping distinguish a defined consolidation range from arbitrary horizontal price movement.
The indicator supports three pattern-size categories:
- Small Pattern
- Medium Pattern
- Large Pattern
Each category can be enabled or disabled independently, allowing traders to control which types of rectangle formations are displayed.
Small, Medium, and Large Rectangle Patterns
Different traders may be interested in different types of market structures.
A short-term trader may want to focus on relatively compact consolidation ranges, while a swing trader may prefer larger formations that develop over a longer sequence of price movement.
Chart Pattern Rectangle provides three pattern-size groups:
Small Patterns
Small patterns are intended to identify more compact rectangle structures.
They can be useful when analyzing shorter-term consolidation and relatively local price ranges.
Medium Patterns
Medium patterns provide a broader structure between short-term and larger consolidation formations.
They can help traders monitor more developed ranges without focusing exclusively on the largest structures.
Large Patterns
Large patterns represent more substantial rectangle formations and can provide additional context when analyzing extended consolidation.
The three pattern groups can be enabled independently, allowing the indicator to adapt to different chart-analysis preferences.
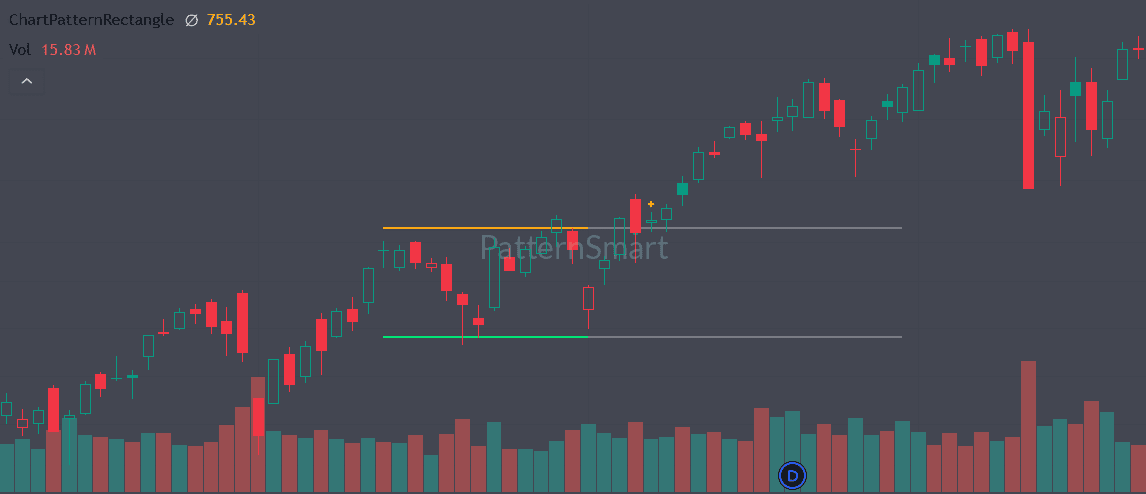
Clearly Defined Upper and Lower Boundaries
Once a qualifying rectangle is identified, the indicator draws two primary horizontal boundaries:
- Upper Rectangle Line
- Lower Rectangle Line
These lines provide an immediate visual representation of the identified trading range.
The upper and lower levels can also be customized through the indicator’s visual settings, including line color, style, and width.
This makes the rectangle easier to distinguish from other chart objects and allows traders to integrate it into their existing TradingView chart layouts.
Rectangle Extension Levels
A rectangle does not necessarily stop being useful when its initial structure ends.
Chart Pattern Rectangle can extend the identified upper and lower levels beyond the original pattern area for a user-defined number of bars.
The Extension Bars setting controls how far these levels are projected.
This creates a useful visual reference area for monitoring what happens after the rectangle has been identified.
For example, traders can use the extended boundaries to observe whether price:
- Breaks above the upper level
- Breaks below the lower level
- Remains within the range
- Begins expanding after consolidation
The extension setting can also be disabled by setting the extension length to zero.
Bullish and Bearish Rectangle Breakouts
One of the key features of Chart Pattern Rectangle is its built-in breakout monitoring.
After a rectangle is detected, the indicator monitors price relative to the identified upper and lower boundaries.
Bullish Breakout
A bullish breakout is identified when the closing price moves above the rectangle’s upper boundary.
The indicator marks the breakout visually and can generate an alert when the breakout condition occurs.
Bearish Breakout
A bearish breakout is identified when the closing price moves below the rectangle’s lower boundary.
The indicator provides a corresponding visual breakout indication and can also generate an alert.
This allows traders to continue monitoring a rectangle after its initial identification rather than treating the pattern as only a historical chart formation.
TradingView Alerts
Chart Pattern Rectangle includes alert functionality for both pattern detection and breakout events.
When enabled, the indicator can generate an alert when:
- A qualifying rectangle pattern is detected
- Price breaks above the upper rectangle boundary
- Price breaks below the lower rectangle boundary
This can help reduce the need to continuously watch the chart for every developing rectangle.
Traders can use TradingView’s alert infrastructure to incorporate the indicator into a broader monitoring workflow.
Show Only the Latest Rectangle
Charts can become visually crowded when multiple historical patterns are displayed.
Chart Pattern Rectangle includes a Show last pattern only option.
When enabled, previous rectangle drawings are removed as a new qualifying pattern is identified, keeping the chart focused on the most recent formation.
When disabled, the indicator can retain previously identified rectangle drawings, allowing traders to examine historical pattern locations.
This provides flexibility between:
- Clean, current-pattern analysis
- Historical pattern review
Customizable Visual Appearance
Chart Pattern Rectangle is designed to integrate naturally with TradingView chart layouts.
Users can customize:
Line Style
Choose from:
- Solid
- Dashed
- Dotted
Line Width
Adjust the width of the rectangle boundaries according to personal chart preferences.
Line Colors
The upper boundary, lower boundary, and extension lines have independent color controls.
This makes it easier to build a consistent visual system when using Chart Pattern Rectangle alongside other indicators and chart tools.
A Structured Approach to Rectangle Analysis
The value of an automated chart pattern indicator is not simply drawing shapes on a chart.
A useful rectangle should represent a meaningful area of price consolidation.
Chart Pattern Rectangle evaluates several aspects of a potential structure before displaying it. The detection process considers the relationship between swing highs and swing lows, the similarity of the upper and lower price boundaries, the overall channel height, and whether price remains contained within the identified range.
This provides traders with a more structured way to locate rectangle formations rather than relying exclusively on subjective manual drawing.
How to Use Chart Pattern Rectangle
A practical workflow can be straightforward.
Step 1: Add the Indicator
Apply Chart Pattern Rectangle to a TradingView chart.
Step 2: Select Pattern Sizes
Enable Small, Medium, and/or Large patterns depending on the type of market structures you want to monitor.
Step 3: Configure Visual Settings
Adjust line style, line width, and colors to fit your chart.
Step 4: Configure Extension
Set the number of extension bars you want to use after the identified rectangle.
Step 5: Monitor the Range
Observe how price behaves between the upper and lower boundaries.
Step 6: Monitor Breakouts
Watch for price closing above the upper boundary or below the lower boundary.
Step 7: Use Alerts if Desired
Enable alerts to receive notifications when rectangle patterns or qualifying breakouts are detected.
Rectangle Patterns as Market Context
A rectangle should not be viewed in isolation.
The pattern describes a period in which price has been contained within a defined range. The broader market context can help traders interpret what that consolidation means.
For example, traders may consider:
- The prevailing market trend
- The timeframe being analyzed
- The location of the rectangle
- Price behavior near the boundaries
- Momentum surrounding a breakout
- Whether multiple timeframes show similar structures
- Broader support and resistance areas
Chart Pattern Rectangle provides the visual structure; traders can then combine that information with their own analysis and trading methodology.
Suitable for Different Trading Styles
Because rectangle patterns can develop across different market conditions and timeframes, the indicator can be incorporated into several approaches.
Day Trading
Use smaller formations to monitor intraday consolidation and potential range expansion.
Swing Trading
Focus on medium or larger rectangle formations to identify more developed consolidation structures.
Breakout Analysis
Use the upper and lower boundaries as reference levels when monitoring potential price expansion.
Technical Chart Analysis
Combine rectangle formations with other technical tools to better understand market structure and price behavior.
Key Features
- Automated Rectangle Pattern detection
- Small, Medium, and Large pattern options
- Upper and lower rectangle boundaries
- Rectangle extension levels
- Bullish breakout detection
- Bearish breakout detection
- Pattern detection alerts
- Breakout alerts
- Show-last-pattern option
- Adjustable horizontal tolerance
- Customizable line style
- Adjustable line width
- Independent boundary colors
- Extension line customization
- TradingView-native implementation
Why Use Chart Pattern Rectangle for TradingView?
Manual chart pattern recognition can be time-consuming, particularly when scanning multiple markets and timeframes.
Chart Pattern Rectangle provides an automated way to identify and visualize qualifying rectangle structures while keeping the underlying chart clean and easy to interpret.
Instead of manually drawing every potential consolidation range, traders can use the indicator to bring attention to structured rectangle formations and then apply their own market analysis.
The result is a practical workflow:
Detect → Visualize → Monitor → Confirm Breakout
The indicator handles the pattern visualization while the trader remains responsible for interpreting market context and making trading decisions.
Frequently Asked Questions
What is Chart Pattern Rectangle for TradingView?
Chart Pattern Rectangle is a TradingView indicator designed to automatically identify qualifying rectangle consolidation patterns and display their upper and lower boundaries directly on the chart.
What is a rectangle chart pattern?
A rectangle is a consolidation structure in which price trades between relatively horizontal upper and lower boundaries.
Does the indicator detect breakouts?
Yes. The indicator monitors the identified rectangle boundaries and can detect bullish breakouts above the upper boundary and bearish breakouts below the lower boundary.
Can I receive alerts?
Yes. Alert functionality can be enabled for rectangle detection and qualifying bullish or bearish breakout events.
Can I display only the newest pattern?
Yes. The Show last pattern only setting allows traders to keep the chart focused on the latest detected rectangle.
Can I customize the rectangle lines?
Yes. Users can customize line style, line width, and colors for the upper, lower, and extension lines.
Can I adjust how far the rectangle levels extend?
Yes. The Extension Bars setting controls the number of bars for which the rectangle boundaries are projected beyond the original pattern.
Does the indicator support different rectangle sizes?
Yes. Small, Medium, and Large pattern categories can be enabled independently.
Conclusion
Chart Pattern Rectangle for TradingView provides an automated and visually structured way to identify rectangle consolidation patterns and monitor what happens when price approaches or breaks their boundaries.
With support for multiple pattern sizes, customizable rectangle boundaries, extension levels, historical or latest-pattern display, and bullish and bearish breakout alerts, the indicator is designed to make rectangle-based chart analysis more systematic.
For traders who regularly study consolidation patterns, range structures, support and resistance, and breakout behavior, Chart Pattern Rectangle can serve as a practical addition to a TradingView technical analysis workflow.