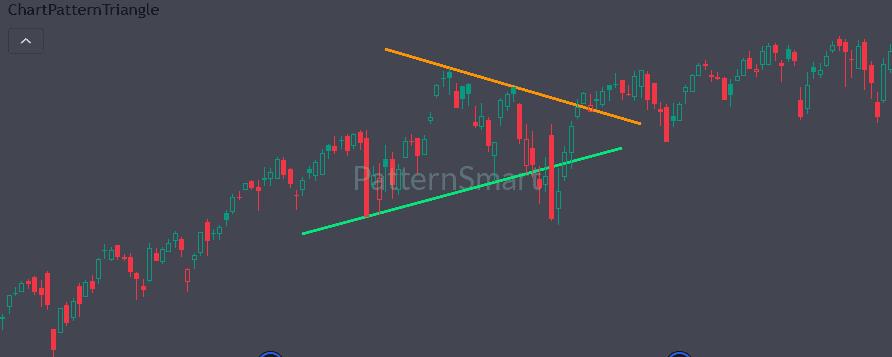
Automate your technical analysis with the Chart Pattern Triangle Indicator for TradingView.
Designed for active traders, swing traders, and technical analysts, this powerful tool automatically identifies and plots high-probability triangle patterns in real time across any financial instrument and timeframe.
By eliminating manual charting subjectivity and missed opportunities, the Chart Pattern Triangle indicator helps you instantly spot market consolidation and prepare for high-momentum breakout trades.
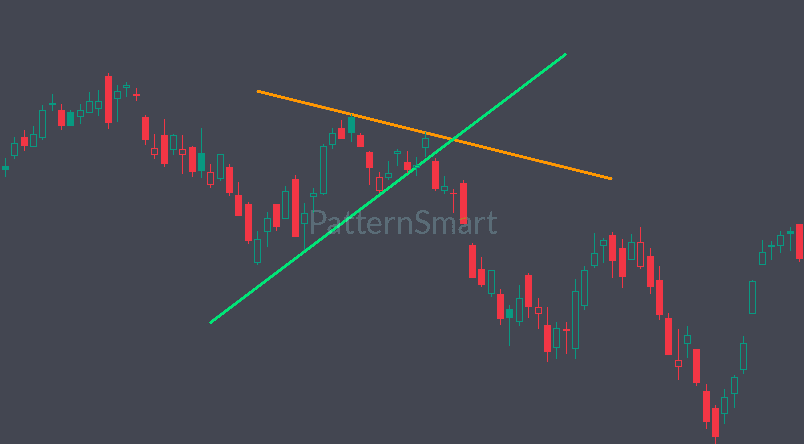
What is the Chart Pattern Triangle Indicator?
Triangle patterns are among the most reliable consolidation structures in classical chart analysis. They reflect periods of price compression where buyers and sellers battle for dominance before an explosive breakout occurs. Manual charting of these geometric structures can be tedious, prone to human error, and easy to miss when monitoring multiple asset classes simultaneously.
The Chart Pattern Triangle Indicator for TradingView solves this challenge by scanning price action dynamically on every bar. Built with strict structural criteria, it filters out false signals and plots exact support and resistance boundary lines directly onto your TradingView charts.
Key Features & Capabilities
- Real-Time Pattern Recognition: Automatically scans incoming price data to detect newly formed triangle structures as soon as they meet structural validity.
- Support for All Three Triangle Types: Fully detects Ascending, Descending, and Symmetrical triangle formations.
- Multi-Scale Pattern Sizes: Look for short-term, medium-term, or long-term consolidation setups using customizable size scales (Small, Medium, Large).
- Automated Alert Notifications: Integrated alert engine triggers instant notifications via webhooks, pop-ups, or email when a valid pattern is identified on bar close.
- Clean & Customizable Graphics: Tailor line styles (Solid, Dashed, Dotted), line thickness, and distinct colors for upper resistance and lower support boundaries.
- Single vs. Historical Display: Choose to view only the most recent pattern to keep your chart decluttered, or display historical patterns to evaluate past consolidation zones.
- Extended Trendline Projection: Automatically projects upper and lower trendlines forward into future price action, providing clear breakout target zones.
Supported Triangle Pattern Types
The indicator accurately classifies patterns based on relative trendline slopes and price swings:
1. Ascending Triangle
An Ascending Triangle features a horizontal resistance upper boundary paired with an ascending (upward-sloping) support trendline. This pattern reflects growing buying pressure hitting a consistent seller level, often preceding a bullish breakout above resistance.
2. Descending Triangle
A Descending Triangle features a horizontal support lower boundary paired with a descending (downward-sloping) resistance trendline. This structure signals aggressive selling pressure pushing down against a static support zone, frequently leading to a bearish breakdown.
3. Symmetrical Triangle
A Symmetrical Triangle consists of converging trendlines where the upper boundary slopes downward and the lower boundary slopes upward. It indicates market equilibrium and volatility contraction, paving the way for a powerful breakout in the direction of the eventual price movement.
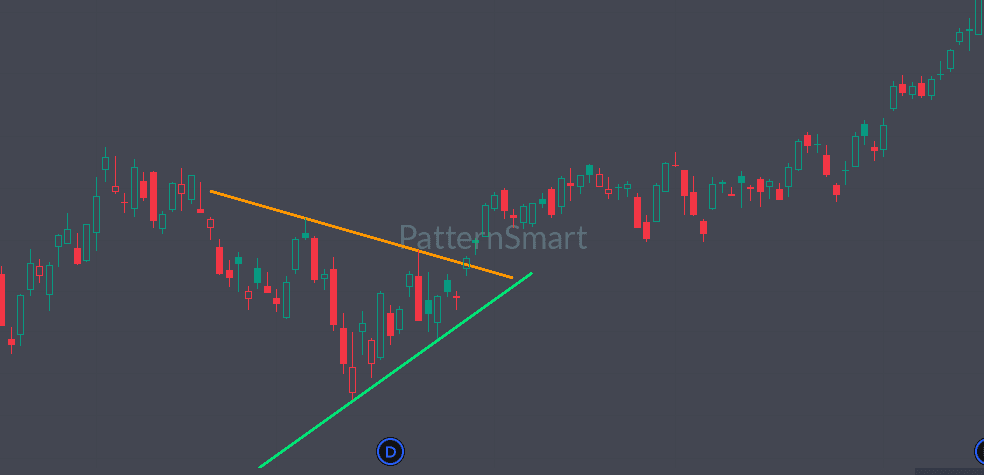
Pattern Size Configurations
Markets move in multi-layered cycles across various micro and macro structure horizons. To give you complete flexibility over your trading strategies, the indicator categorizes pattern lengths into three distinct dimensions:
| Size Scale | Description | Best Suited For |
| Small | Scans tight pivot ranges | Scalpers, momentum intraday traders |
| Medium | Scans balanced swing ranges (Enabled by Default) | Day traders and short-term swing traders |
| Large | Scans extended multi-bar consolidation ranges | Position traders and long-term investors |
Note: You can combine multiple size scales simultaneously to analyze nested patterns across different structural depth layers.
How It Works in Your Trading Strategy
Integrating automated triangle pattern detection into your daily routine streamlines your charting workflow and enhances risk management:
- Spot Volatility Contraction: Automatically highlight areas where price action is coiling and preparing for an impending move.
- Set Pre-Breakout Watchlists: Monitor multiple tickers and timeframes concurrently, letting automated alerts highlight potential trade setups.
- Define Clear Invalidation Levels: Utilize the plotted boundary lines to place precise stop-loss orders just outside the triangle parameter lines.
- Combine with Volume & Oscillators: Pair triangle pattern detection with volume spikes or momentum indicators (such as RSI or MACD) to confirm breakout validity.
Indicator Settings & Parameters Guide
Customize every parameter to match your charting workflow:
Pattern Types
- Show Ascending Triangle: Toggle to enable or disable bullish ascending triangle detection.
- Show Descending Triangle: Toggle to enable or disable bearish descending triangle detection.
- Show Symmetrical Triangle: Toggle to enable or disable neutral symmetrical triangle detection.
Pattern Size
- Enable Small: Scan short pivot sequences.
- Enable Medium: Scan standard swing pivot sequences.
- Enable Large: Scan broader macro pivot sequences.
Parameters
- Show Last Pattern Only: When enabled, automatically removes historical line drawings from the chart, displaying only the active pattern to maintain maximum chart clarity.
- Alert: Toggles real-time execution alerts.
- Extension Bars: Controls how many bars into the future the boundary trendlines extend beyond the pattern’s endpoint.
Line Style & Colors
- Line Style: Choose between
Solid,Dashed, orDottedline renderings. - Line Width: Adjust the pixel thickness of boundary lines.
- Upper Line Color: Customize visual style for the upper resistance trendline.
- Lower Line Color: Customize visual style for the lower support trendline.
Step-by-Step Installation Guide
Adding the Chart Pattern Triangle Indicator to your TradingView account is quick and straightforward:
- Open TradingView: Navigate to your interactive chart on TradingView.
- Access Pine Editor: Click on the Pine Editor tab located at the bottom toolbar of your chart workspace.
- Insert Code: Paste the script into the editor window.
- Save Script: Click Save in the top-right corner of the Pine Editor and give the script a recognizable name (e.g.,
ChartPatternTriangle). - Add to Chart: Click Add to Chart. The indicator will immediately scan the active financial symbol and plot detected triangle formations directly onto your price pane.
Frequently Asked Questions (FAQ)
What markets and assets does this indicator support?
The indicator works seamlessly across all liquid financial markets supported by TradingView, including Forex, Cryptocurrency, Stocks, Indices, Commodities, and Futures.
Which timeframes are supported?
You can apply the Chart Pattern Triangle indicator to any time resolution available on TradingView, from 1-minute intraday charts to daily, weekly, and monthly bar intervals.
Can I set up automated alerts?
Yes. You can create native TradingView alerts directly from the indicator. Select the indicator in the Create Alert menu and set your preferred notification method (Pop-up, App Notification, Email, or Webhook).
Does this indicator repaint historical patterns?
No. The indicator evaluates confirmed bar pivot points and draws pattern boundary trendlines upon bar closure, ensuring that backtested visuals accurately reflect real-time live execution conditions.