TradingView Donchian Breakout Indicator with an ATR Range Filter: Complete Pine Script v6
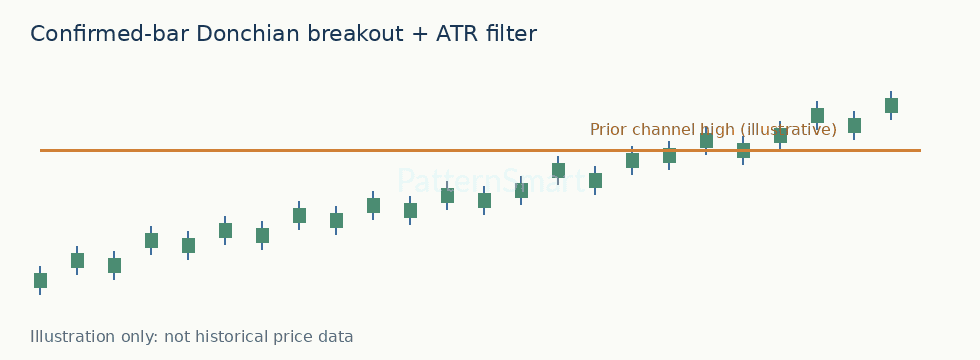
A Donchian channel answers a precise question: what was the highest high and lowest low over the preceding N completed candles? This TradingView study identifies a confirmed close beyond that historical boundary and requires the breakout candle to have a meaningful range relative to ATR. It is a research and alert tool, not an automatic trading system.
Why use a prior-bar channel?
For an upside test, define H(t)=max(high[t-1],…,high[t-N]). For downside, L(t)=min(low[t-1],…,low[t-N]). Using the current candle in the maximum would make close > highest(high,N) impossible on a normal OHLC candle, because close cannot exceed its own high. The [1] offset is essential.
Signal rules and calculations
ATR(14) is TradingView's average true range, with true range max(high-low, abs(high-previous close), abs(low-previous close)) smoothed using Wilder's RMA. The candle-range filter is high-low >= 0.75 * ATR(14). An upside signal requires a completed candle closing above H(t), with the prior completed candle not closing above its own preceding channel high. The downside is symmetric. The edge condition suppresses repeated markers during an uninterrupted breakout state; it does not guarantee one signal per trend.
Illustrative numerical example
Suppose the prior 20-candle high is 102.40, ATR is 1.20, and the newly completed candle has high 103.10, low 101.90 and close 102.75. Its range is 1.20, above the 0.90 minimum (0.75 × 1.20), and its close is above 102.40. If the previous candle closed at or below its own prior-channel high, an upside marker prints. These are hypothetical numbers, not market observations.
Complete Pine Script v6 source
Paste this entire indicator into TradingView Pine Editor:
//@version=6
indicator("Confirmed Donchian ATR Breakout", overlay = true, max_labels_count = 500)

// User inputs: all price comparisons use completed candles only.
length = input.int(20, "Donchian lookback", minval = 2)
atrLength = input.int(14, "ATR length", minval = 1)
minRangeAtr = input.float(0.75, "Minimum candle range / ATR", minval = 0.0, step = 0.05)
showChannel = input.bool(true, "Show prior channel")

// [1] excludes the active candle: no self-referencing breakout threshold.
priorHigh = ta.highest(high, length)[1]
priorLow = ta.lowest(low, length)[1]
atr = ta.atr(atrLength)
ready = not na(priorHigh) and not na(priorLow) and not na(atr) and atr > 0
rangePass = ready and (high - low) >= minRangeAtr * atr
longSignal = barstate.isconfirmed and rangePass and close > priorHigh and close[1] <= priorHigh[1]
shortSignal = barstate.isconfirmed and rangePass and close < priorLow and close[1] >= priorLow[1]

plot(showChannel ? priorHigh : na, "Prior high", color = color.orange, linewidth = 2)
plot(showChannel ? priorLow : na, "Prior low", color = color.aqua, linewidth = 2)
plotshape(longSignal, title = "Confirmed upside breakout", style = shape.triangleup, location = location.belowbar, color = color.lime, size = size.small, text = "UP")
plotshape(shortSignal, title = "Confirmed downside breakout", style = shape.triangledown, location = location.abovebar, color = color.red, size = size.small, text = "DN")
alertcondition(longSignal, "Confirmed upside breakout", "Confirmed Donchian upside breakout on {{ticker}} {{interval}}")
alertcondition(shortSignal, "Confirmed downside breakout", "Confirmed Donchian downside breakout on {{ticker}} {{interval}}")
Setup and validation
- Open a chart, choose Pine Editor, paste the code, save and add to chart.
- Start with Donchian 20, ATR 14, and minimum range ratio 0.75.
- Compare each marker against the previous 20 completed highs/lows and the candle close.
- Create an alert using one of the two named alert conditions and choose Once Per Bar Close.
- Test on several symbols and timeframes; inspect gaps, session boundaries, illiquid bars and corporate-action adjustments.
Repainting, execution and limitations
barstate.isconfirmed avoids signaling before the chart candle closes. Historical signals use completed bars, but live alerts depend on TradingView's data feed and alert settings. The script does not call request.security(), so it has no higher-timeframe lookahead issue. A breakout can fail immediately; ATR measures movement, not directional conviction. The range filter may reject quiet valid moves or accept news-driven spikes. A close beyond a rolling channel is not the same as an executable fill at that close, and spread, slippage, commissions and liquidity can materially change outcomes.
Practical improvements
Traders may evaluate separate long/short thresholds, volume filters, trend regime filters, or a retest confirmation. Avoid optimizing thresholds solely on one historical sample: reserve out-of-sample periods and compare false-breakout rates. For bespoke scanner or alert integration, see Custom Trading Software Development Services.
Risk notice: Educational example only, not investment advice or a promise of profit. Backtest with realistic transaction costs and independently verify code behavior before relying on signals.