ATR Trailing Stops Explained: How to Adjust Risk to Market Volatility
A fixed 20-point stop means very different things in a quiet market and a volatile one. The Average True Range (ATR) offers a way to express a stop distance in units of recent price movement rather than arbitrary points or percentages. ATR does not predict direction; it estimates how much prices have been moving. Used carefully, an ATR-based trailing stop can help a trader adapt an exit plan to changing conditions.
1. What ATR actually measures
For each completed bar, True Range (TR) is the largest of three quantities: the current high minus low, the absolute distance between the current high and previous close, and the absolute distance between the current low and previous close:
TR = max(H − L, |H − Cprev|, |L − Cprev|).
These latter two terms capture gaps that the high-low range alone would miss. Wilder's conventional ATR uses a 14-period lookback, first averaging 14 TR values and then smoothing with ATRt = (13 × ATRt−1 + TRt) / 14. Other platforms may offer simple or exponential ATR variants; confirm the implementation before comparing readings.
2. From volatility estimate to stop distance
A basic ATR stop uses a multiple k of ATR: stop distance = k × ATR. For a long trade entered at 100 with ATR = 2.0 and k = 2.5, the illustrative initial stop is 100 − (2.5 × 2) = 95. For a short entered at 100, the corresponding illustrative stop is 105. These are hypothetical calculations, not historical quotes or recommended settings.
Higher multipliers create wider stops and may tolerate more normal noise, but they increase risk per unit of position size. Lower multipliers are tighter, yet more vulnerable to routine price fluctuations. There is no universally optimal multiplier.
3. The important difference: initial stop versus trailing stop
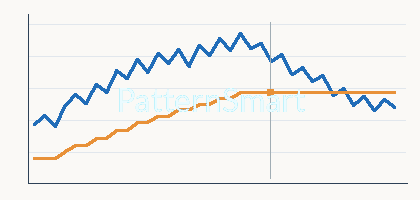
A trailing stop must specify what price anchors the stop. One common long-only model is a chandelier-style exit: candidate = highest high over N completed bars − k × ATR. To keep the stop from moving backward, use stopt = max(stopt−1, candidatet) while the position remains open. For a short, use a lowest-low anchor plus k × ATR, with a min rule to prevent the stop from rising. A new trade resets the trailing state.
Some tools instead trail from the highest closing price since entry, the most recent close, or a moving average. Those are different methods, even if all use ATR. Always inspect the formula before comparing signals.
4. A practical worked example
| Completed bar | Highest high (lookback) | ATR | k × ATR | Candidate | Active long stop |
|---|---|---|---|---|---|
| 1 | 105.0 | 2.0 | 5.0 | 100.0 | 100.0 |
| 2 | 108.0 | 2.2 | 5.5 | 102.5 | 102.5 |
| 3 | 108.0 | 3.0 | 7.5 | 100.5 | 102.5 |
| 4 | 111.0 | 2.4 | 6.0 | 105.0 | 105.0 |
All figures are invented purely to demonstrate the arithmetic. With k = 2.5, the third bar's volatility spike lowers the candidate to 100.5, but the active stop stays at 102.5 because the long trailing rule does not loosen it. At bar 4 the stop advances to 105.0.
5. Position sizing must use actual stop risk
Suppose an account permits a hypothetical $200 risk budget and the stop is 5 price units away. If one unit of price movement is worth $10 per contract, the pre-cost risk is $50 per contract, implying at most four contracts before accounting for fees, slippage, gap risk, and instrument-specific sizing constraints. The generic formula is quantity = risk budget ÷ (stop distance × monetary value per price unit), rounded down to valid trade increments. For equities, the monetary value per $1 share movement is normally $1 per share; futures require the contract's point value. Realized losses can exceed a planned stop in a fast or gapping market.
6. Implementation details that change the result
- Bar-close versus intrabar: A stop calculated only on completed bars is more stable, but a live broker stop can be hit before the bar closes. Never assume identical historical and live fills.
- Lookback anchor: Highest high of the last N bars is not necessarily highest high since entry. Document the choice.
- Volatility regime: ATR can rise sharply during a selloff and fall in consolidation. A trailing stop that never loosens behaves differently from one recalculated freely every bar.
- Gaps and costs: Stops do not guarantee execution at the stop price. Include commissions, spread and slippage in tests.
- Trend versus range: Trend-following exits can give back open profit during reversals; range-bound price action can trigger repeated stop-outs.
7. How to validate an ATR stop without curve-fitting
Define the entry rules independently of the exit. Compare ATR periods (for example, 10, 14 and 20) and multipliers (for example, 2, 2.5 and 3) over in-sample and untouched out-of-sample periods, across volatile and quiet regimes. Record average loss, maximum drawdown, turnover, slippage sensitivity and risk-adjusted performance, not just win rate. A robust approach should not depend on one exact parameter combination.
8. Final takeaway
ATR converts recent volatility into a measurable risk distance. The trailing-stop anchor, ratchet rule, position sizing and execution assumptions determine whether that distance is useful. Traders building platform-specific indicator visualizations or automated risk tools can explore Custom Trading Software Development Services to implement and inspect these rules consistently.
Educational material only. Not personalized investment advice, and no stop methodology eliminates market or execution risk.