This product is part of the:ADX Divergence Indicator all-in-one package for Thinkorswim
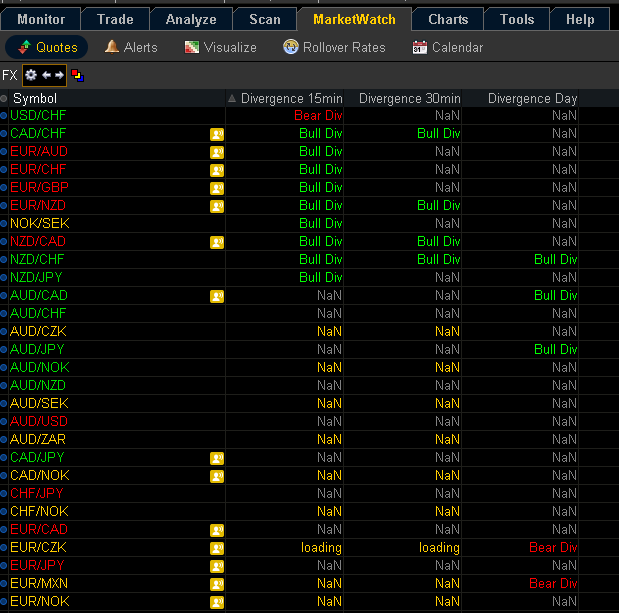
This custom study will help you to quickly identify the ADX Divergence signals in the Watchlist.
It will detect all Positive/Negative (bearish/bullish) ADX Divergence based on your settings.
The algorithm of this Custom Quotes is same as our ADX Divergence indicator.
Parameters:
- You can change all ADX (Relative Strength Index) parameters:
- ADX length: The number of bars used to calculate the ADX.
- average type: The type of moving average to be used in calculations: simple, exponential, weighted, Wilder’s, or Hull.
- Length 1&2: Define the range of bars which are used to calculate the current High/Low and previous High/Low.
- Percent: The difference current High/Low and previous High/Low.
- ADX_Percent: The difference between current ADX and the ADX value from previous High/Low.
- Scan in any time frames, 5mins, 15mins, 30mins, 1 day, 1 week, 1 month.
- Applicable for all securities(Stocks, Futures, Forex, Options, ETF, etc.).

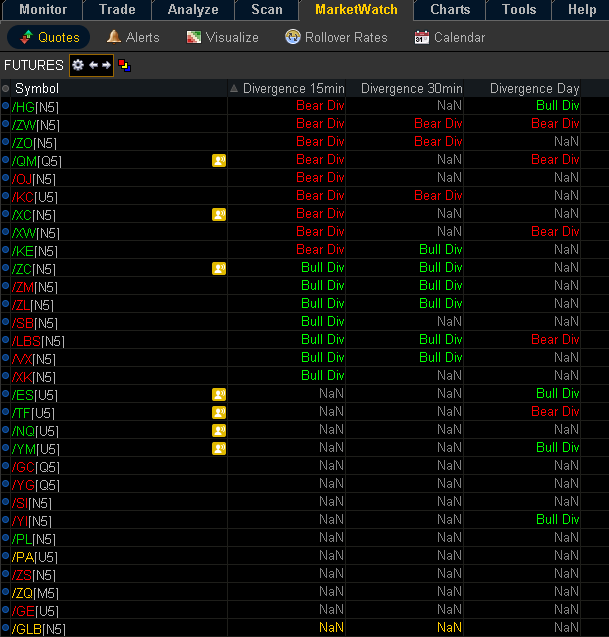
The pictures only show 3 different timeframes.
But you can have all of the timeframes listed on the screen at the same time in different columns.