This package includes the Thinkorswim TOS Auto Trend line indicator, Trend line breakout SCAN and custom quote for watchlist.
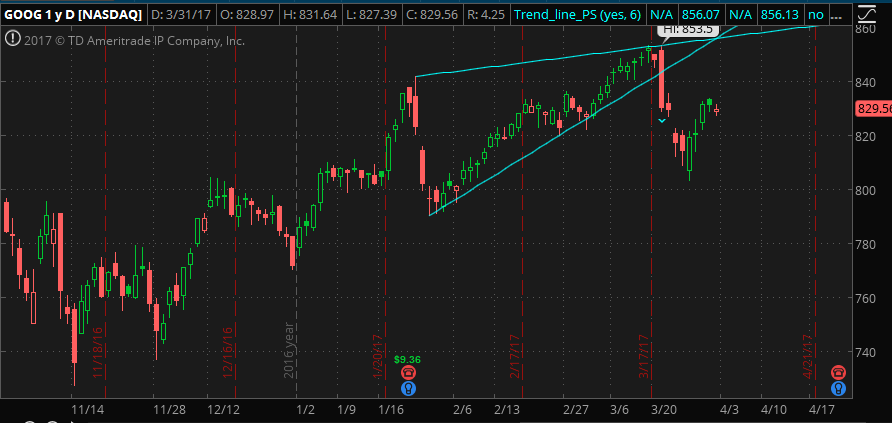
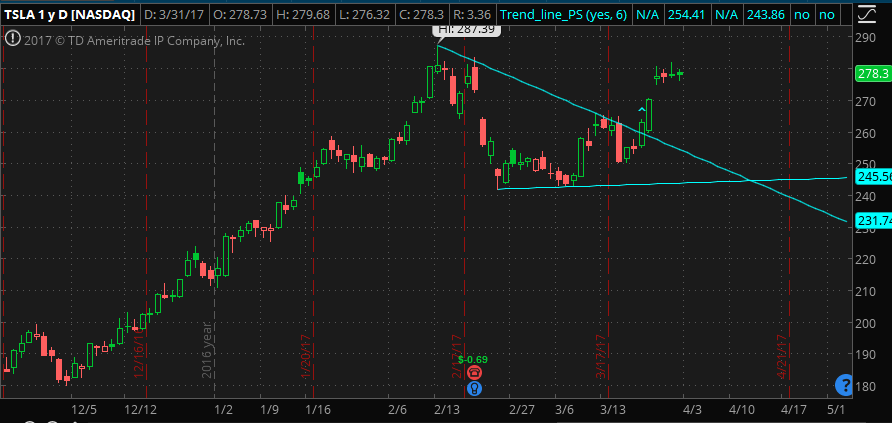
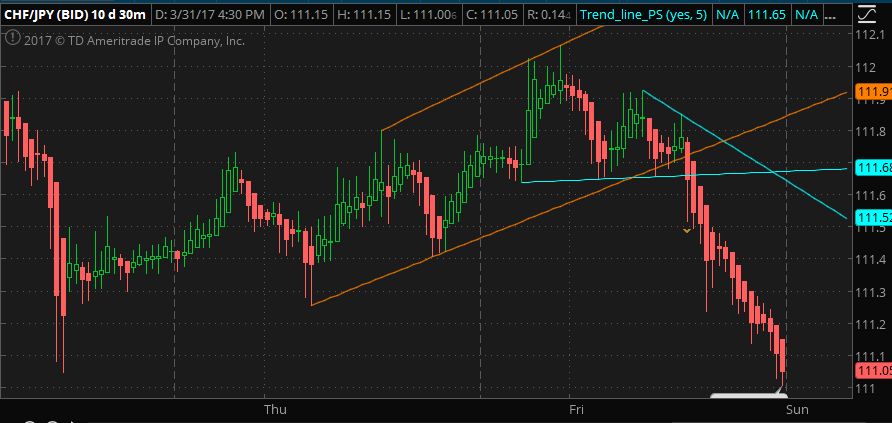
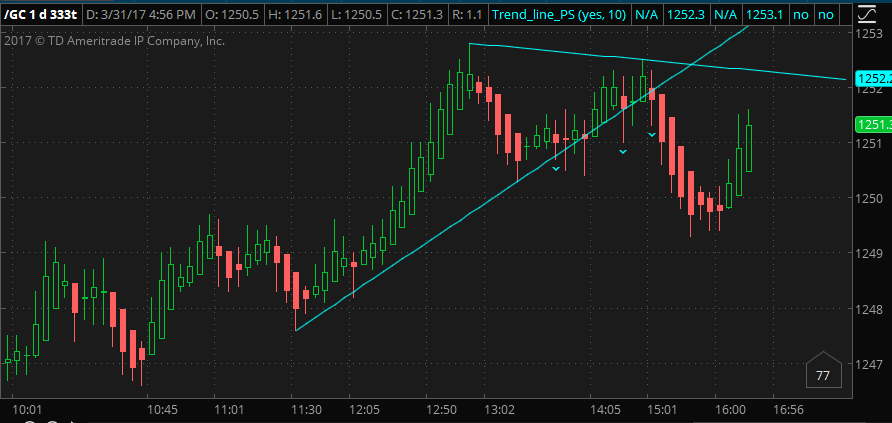
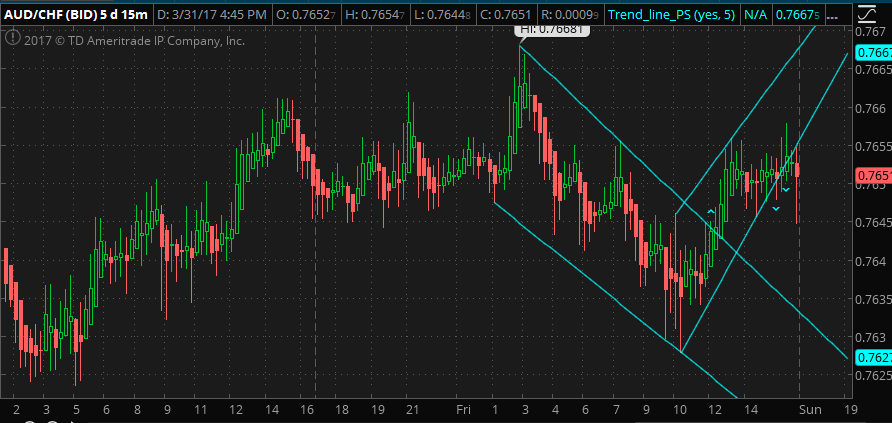
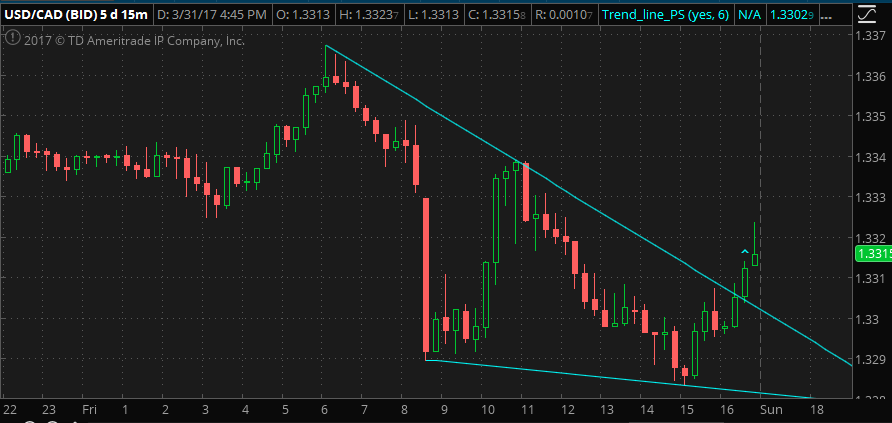
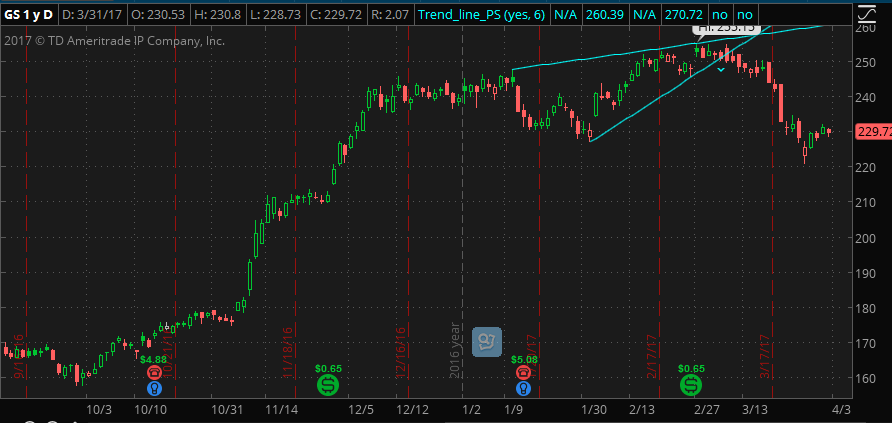
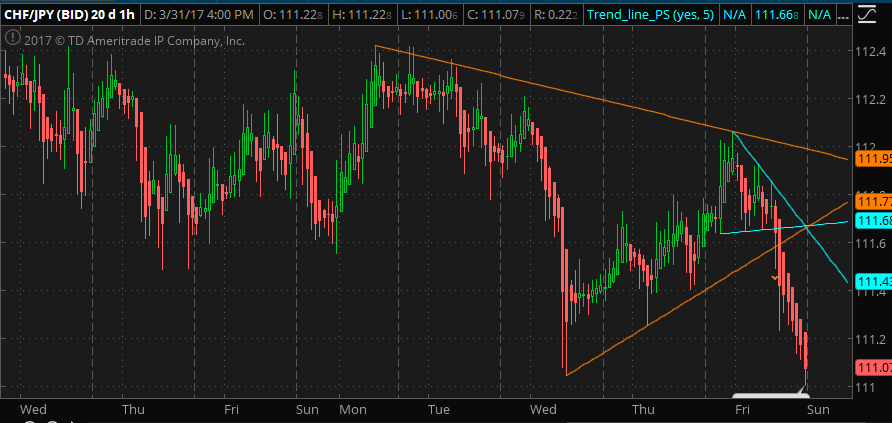
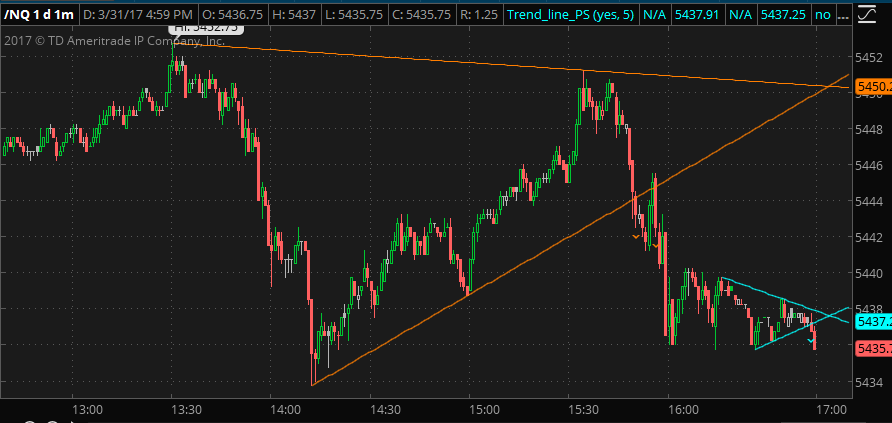
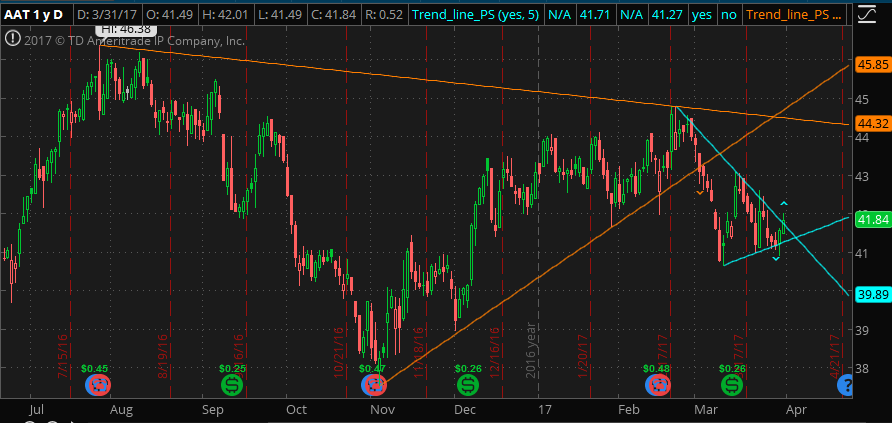
The Trend line indicator plots lines for both uptrend and downtrend.
The line above the price is formed by two recent swing highs, and the line below the price is formed by two recent swing lows.

You
will be able to define the strength of swing high and low in order to
detect long term, mid term and short term trend lines. The input Strength is the number of bars on the left and right side of the swing point.
It will alert when the price either cross above the upper trend line, or cross below the lower trend line.
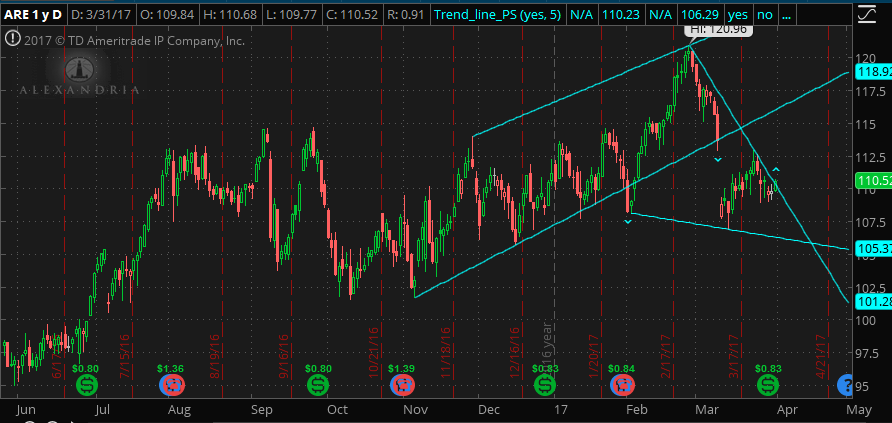
It works on any timeframe and all kind of securities (Stock, Forex, Futures, etc.)
The
Trend line SCAN will search and find all symbols with last price that
closes above the upper trend line or below the lower trend line.
The SCAN and custom quote can also be customized to meet your requirement.
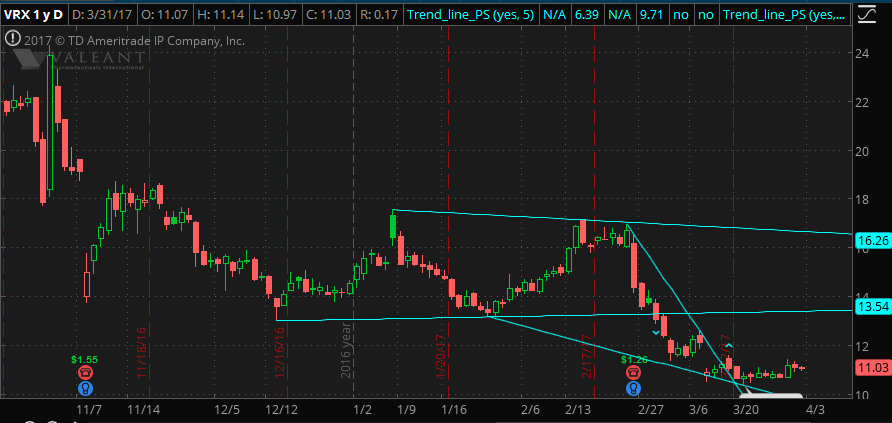
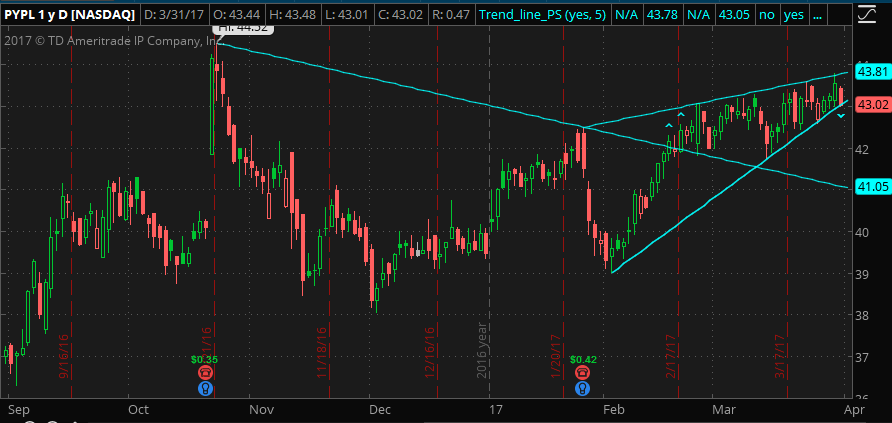
You can always apply this indicator multiple times with different “Strength” settings to detect long term, mid term and short term trend lines on the same chart. For example, you can use one with Strength=6 and another with Strength=12. In fact, you can add it as many times as you like, just like the moving average indicator.
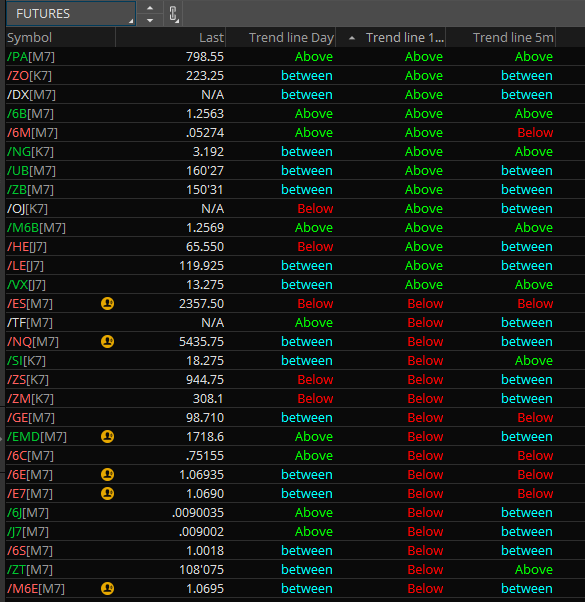
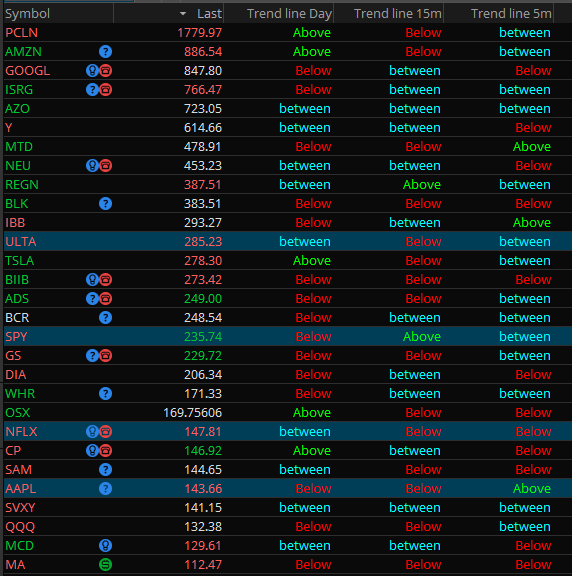
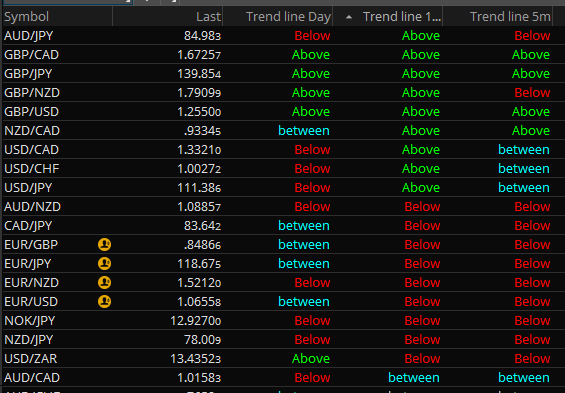
The custom quote will show the relative position of current price in watchlist.
If Close is above the upper trend line, it will show “Above”
If Close is below the lower trend line, it will show “Below”
If Close is between the upper and lower trend line, it will show “Between”
You can apply it to more than one column with different timeframe.
Looks cool. How do I get a copy of the script?
Please purchase it from http://www.patternsmart.com/cart/index.php?route=product/product&product_id=374&search=auto+trend