Average True Range (ATR) Explained: Measuring Volatility Without Predicting Direction
Average True Range (ATR) answers a practical question: how much does an instrument typically move per bar? It does not answer whether the next bar will rise or fall. Traders use ATR to compare volatility regimes, plan risk distances, and avoid treating a fixed number of points as equally meaningful in every market condition.
How ATR Is Calculated
For each bar, True Range (TR) is the largest of three values:
TR = max(High − Low, |High − Previous Close|, |Low − Previous Close|).
The previous close matters because an overnight gap can make the true movement larger than the current bar's high-low range. The classic Wilder ATR uses an initial average of the first n true ranges, then the recursive smoothing formula ATR(t) = [ATR(t−1) × (n−1) + TR(t)] / n. A common lookback is 14 bars; it is a convention, not a universally optimal setting. Some platforms offer a simple moving average of TR instead, so verify the calculation when comparing values.
Reading an ATR Chart Correctly
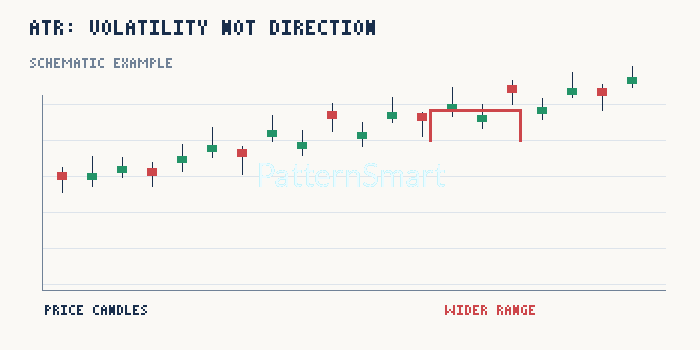
Rising ATR indicates larger recent true ranges; falling ATR indicates smaller ones. ATR can rise during a selloff, a rally, or choppy two-sided trading. An ATR reading of 2.0 is expressed in the instrument's price units, not as a universal percentage. Compare it with the instrument's price and timeframe before drawing conclusions.
A Worked Example: True Range With a Gap
Suppose the previous close is 100, today's high is 105, and today's low is 102. The three candidates are 3, 5, and 2. True Range is therefore 5, even though the visible intraday high-low range is only 3. If the prior 14-period ATR was 2.4, the next Wilder ATR is (2.4 × 13 + 5) / 14 ≈ 2.586. This is a hypothetical arithmetic example, not a market observation.
Using ATR for Stop Distance and Position Sizing
One risk-planning approach is to place a volatility allowance around a technically justified invalidation level, rather than choosing a stop solely from ATR. For illustration, a trader might consider a 2×ATR distance. If ATR is $1.50 per share, that distance is $3.00 per share. With a hypothetical maximum planned loss of $150, the simple share count would be 150/3 = 50 shares, before commissions, slippage, gaps, and instrument-specific contract multipliers.
This calculation does not make the stop safe or guarantee a $150 maximum loss: stops can fill worse than intended. A volatility-based stop may also be too wide for the trading thesis, and position size must respect account and instrument constraints.
ATR Versus Directional Confirmation
| Observation | Reasonable interpretation | What it does not prove |
|---|---|---|
| Price breaks resistance; ATR rises | Range expansion accompanies the breakout | That the breakout will hold |
| Price trends higher; ATR falls | Uptrend continues with smaller recent ranges | That the trend is about to reverse |
| ATR spikes after a gap | Recent true range includes a large discontinuity | That future bars will match the spike |
Confirm a directional thesis with market structure, closing prices relative to relevant levels, volume where meaningful, and the higher-timeframe context. ATR can describe the size of the move; it cannot independently validate its direction.
Common ATR Mistakes
- Confusing ATR with momentum: large ranges do not imply bullishness.
- Comparing raw ATR across different prices: normalize as ATR/price × 100% when a percentage comparison is appropriate.
- Ignoring timeframe: a 14-bar ATR on a five-minute chart is not interchangeable with a daily ATR.
- Using fixed multipliers blindly: the stop location should follow the trade's invalidation logic and liquidity conditions.
- Overlooking smoothing differences: Wilder smoothing and simple averaging can produce different results.
Practical Checklist
Define the instrument and timeframe; verify the ATR smoothing method; locate the price structure that would invalidate the trade; estimate volatility-adjusted risk; and check whether gaps, news events, or liquidity could make actual execution materially worse than the planned stop.
For teams building research dashboards or automated risk controls, Custom Trading Software Development Services can help translate clearly specified ATR calculations and risk rules into platform-specific tools.
Risk Disclaimer
This article is for education only and is not investment advice. Technical indicators are derived from past prices, do not predict outcomes reliably, and cannot eliminate trading losses. Test methods and consider transaction costs, leverage, and gap risk before risking capital.