Introduction
Multi-timeframe analysis is one of the most powerful techniques used by professional traders. By evaluating market conditions across different chart periods, traders can better identify trends, confirm signals, and filter out market noise. While cTrader provides access to multiple chart timeframes, developing a custom multi-timeframe indicator allows traders and developers to automate this process and gain deeper market insights directly on a single chart.
In this article, you’ll learn the principles behind multi-timeframe indicators, the advantages they offer, and the key steps involved in building custom multi-timeframe solutions for cTrader.
What Is a Multi-Timeframe Indicator?
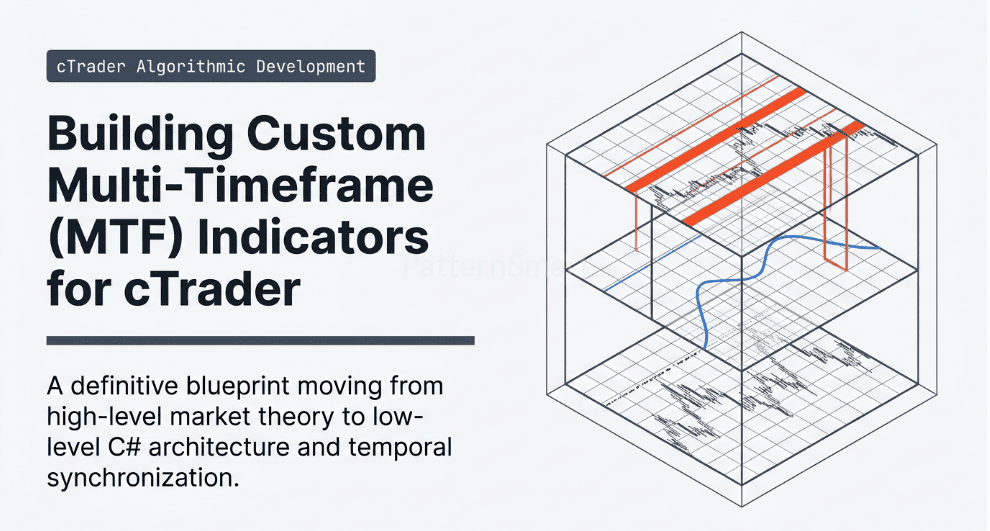
A multi-timeframe (MTF) indicator is a technical analysis tool that retrieves and processes price data from two or more timeframes simultaneously.
For example:
- A trader may view a 5-minute chart while monitoring trend direction on the 1-hour chart.
- An indicator could display daily support and resistance levels on a 15-minute chart.
- A trend-following system may use weekly trend confirmation before generating signals on an hourly chart.
Instead of constantly switching between charts, a custom MTF indicator consolidates information from multiple timeframes into one visual tool.
Why Use Multi-Timeframe Analysis?
Improved Trend Identification
Higher timeframes generally provide a clearer view of the dominant market trend. By incorporating higher timeframe data into your indicator, you can avoid trading against major market momentum.
Better Signal Confirmation
Signals generated on lower timeframes often produce false entries due to short-term volatility. Higher timeframe confirmation helps improve signal reliability.

Enhanced Market Context
Understanding both macro and micro market movements allows traders to make more informed decisions.
Reduced Chart Clutter
Rather than opening multiple chart windows, traders can access critical information directly from a single chart.

Common Multi-Timeframe Indicator Applications
Custom MTF indicators can be used for a wide range of trading strategies:
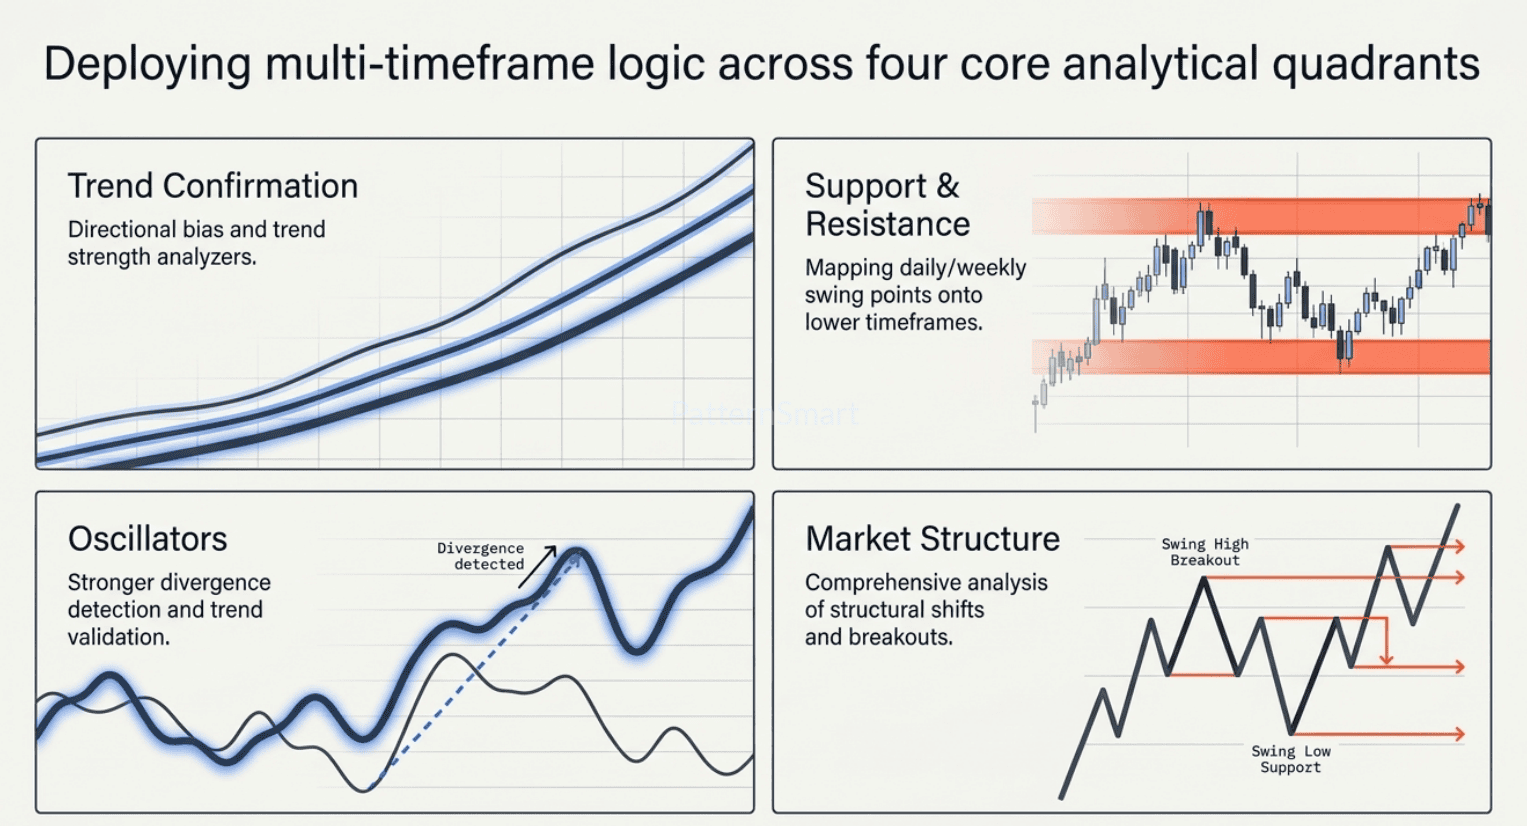
Trend Confirmation Indicators
These indicators compare trend direction across several timeframes and display alignment conditions.
Common implementations include:
- Multi-timeframe moving averages
- Trend strength analyzers
- Directional bias indicators
Support and Resistance Mapping
Many traders prefer plotting higher timeframe levels onto lower timeframe charts.
Examples include:
- Daily support and resistance zones
- Weekly swing points
- Monthly highs and lows
Multi-Timeframe Oscillators
Oscillators such as RSI, Stochastic, or MACD can be calculated from higher timeframes while displayed on a lower timeframe chart.
Benefits include:
- Stronger divergence detection
- Trend validation
- Improved entry timing
Market Structure Analysis
Advanced indicators can analyze swing highs, swing lows, breakouts, and trend structure from multiple timeframes to provide a comprehensive market framework.
Understanding Timeframe Relationships
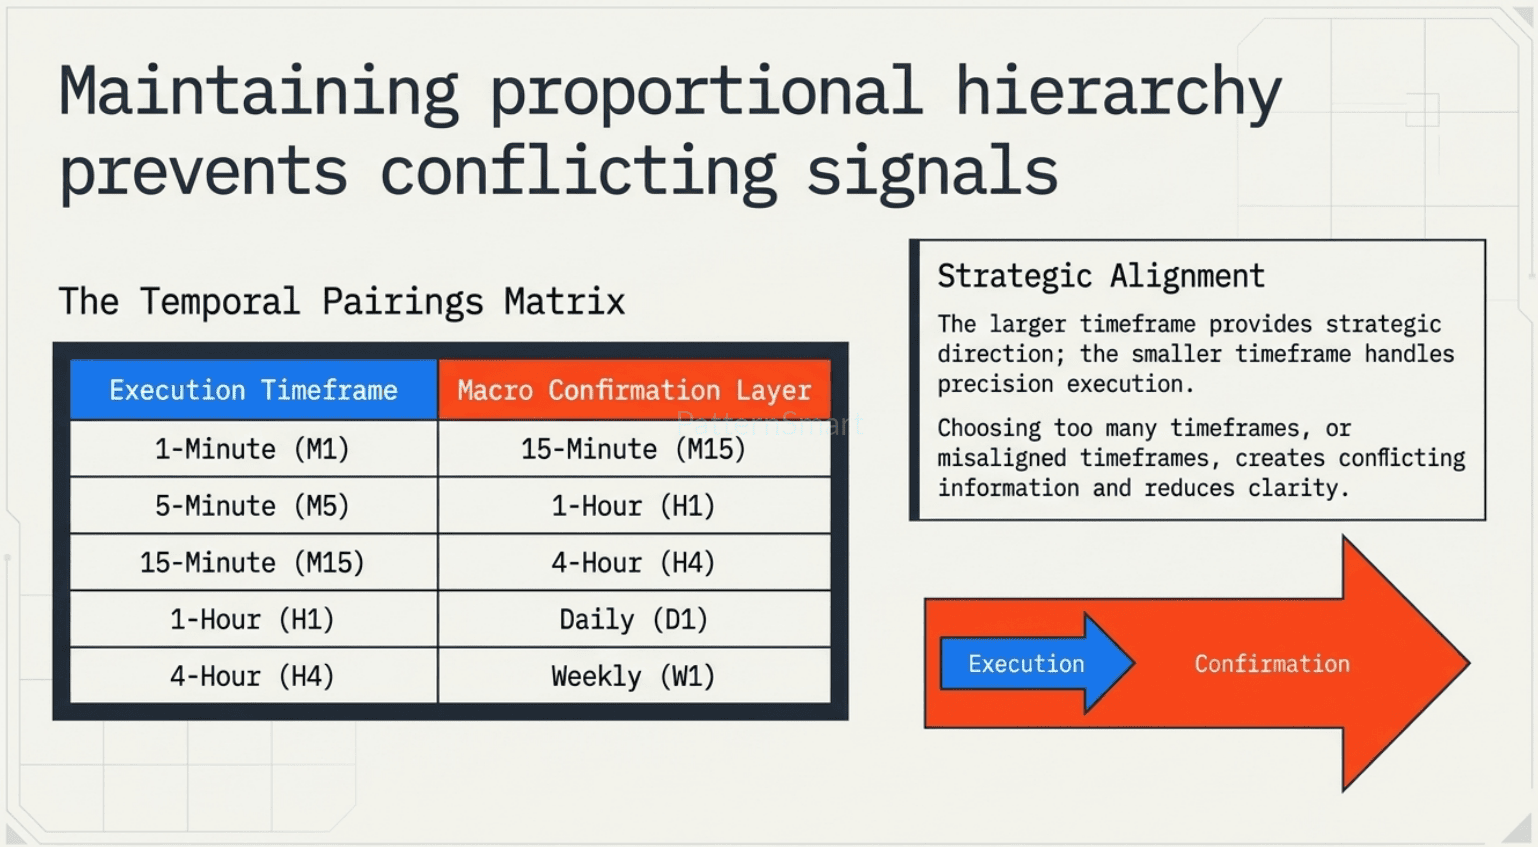
Before developing any MTF indicator, understanding timeframe hierarchy is critical.
A common approach is:
| Lower Timeframe | Confirmation Timeframe |
|---|---|
| M1 | M15 |
| M5 | H1 |
| M15 | H4 |
| H1 | Daily |
| H4 | Weekly |
The larger timeframe provides strategic direction while the smaller timeframe handles trade execution.
When designing indicators, maintaining logical timeframe relationships improves reliability and reduces conflicting signals.
Accessing Multiple Timeframes in cTrader
One of the strengths of cTrader’s algorithmic environment is its ability to retrieve market data from different timeframes within a single indicator.
Developers can access:
- Historical bars
- Open, High, Low, Close (OHLC) values
- Volume information
- Market statistics
This flexibility enables custom indicators to process data from multiple periods simultaneously while keeping calculations synchronized.
Proper data handling is essential because higher timeframe bars update differently than lower timeframe bars. Ensuring accurate alignment between data series is often one of the most important aspects of MTF indicator development.
Designing an Efficient Multi-Timeframe Indicator
1. Define the Core Objective
Every indicator should solve a specific trading problem.
Examples:
- Confirm trend direction
- Display higher timeframe support levels
- Filter trading signals
- Identify market structure shifts
Clearly defining the objective simplifies the development process.
2. Select Appropriate Timeframes
Choosing too many timeframes may create conflicting information and reduce clarity.
Many professional developers limit indicators to:
- Primary timeframe
- One confirmation timeframe
- One major trend timeframe
This approach keeps signals clean and actionable.
3. Optimize Calculations
Multi-timeframe indicators often process significantly more data than standard indicators.
Optimization considerations include:
- Avoiding redundant calculations
- Limiting unnecessary historical processing
- Updating only when new bars are formed
- Efficiently managing memory usage
Optimized indicators deliver faster performance and improved responsiveness.
4. Create Clear Visualizations
The most successful indicators communicate information quickly.
Popular visualization methods include:
- Color-coded trend states
- Dashboard displays
- Signal arrows
- Background trend shading
- Support and resistance zones
Traders should be able to interpret the indicator instantly without extensive analysis.
Managing Data Synchronization
One challenge in multi-timeframe development is synchronizing data from different chart periods.
For example:
- A 1-hour bar contains multiple 5-minute candles.
- A daily candle contains twenty-four 1-hour bars.
- Weekly charts aggregate several daily bars.
Developers must ensure lower timeframe calculations reference the correct higher timeframe bar.
Improper synchronization can produce:
- Delayed signals
- Repainting behavior
- Inconsistent results
- Historical inaccuracies
Thorough testing across different market conditions is essential for validation.
Preventing Repainting Issues
Repainting is a common concern when working with higher timeframe data.
An indicator may appear accurate on historical charts but behave differently in live conditions if unfinished higher timeframe bars are used improperly.
Best practices include:
- Using confirmed bar data when appropriate
- Testing in live market environments
- Verifying historical consistency
- Documenting signal-generation logic
Reliable indicators prioritize consistency over overly aggressive signal generation.

Enhancing User Flexibility
Professional MTF indicators often provide customization options such as:
Timeframe Selection
Allow users to choose which timeframes the indicator monitors.
Alert Configuration
Support alerts for:
- Trend alignment
- Breakouts
- Signal confirmations
- Support or resistance interactions
Visual Preferences
Enable customization for:
- Colors
- Line styles
- Labels
- Dashboard positioning
Flexible settings improve usability across different trading styles.
Testing and Validation
Before releasing a custom multi-timeframe indicator, developers should conduct extensive testing.
Recommended testing procedures include:
Historical Validation
Verify calculations across multiple symbols and market conditions.
Live Market Testing
Ensure signals behave as expected during real-time market updates.
Cross-Timeframe Verification
Compare displayed data against actual higher timeframe charts.
Performance Evaluation
Measure indicator responsiveness during volatile market periods.
Comprehensive testing helps identify synchronization issues before users encounter them.
Best Practices for Professional Multi-Timeframe Development
When creating advanced cTrader indicators, consider the following guidelines:
- Keep calculations efficient.
- Use meaningful timeframe combinations.
- Avoid excessive visual clutter.
- Prioritize signal accuracy over frequency.
- Implement robust error handling.
- Validate data synchronization thoroughly.
- Offer configurable user inputs.
- Test across multiple market instruments.
Following these practices results in indicators that are both reliable and trader-friendly.
Conclusion
Custom multi-timeframe indicators can significantly enhance trading analysis by combining information from multiple chart periods into a unified decision-making tool. Whether you’re building trend confirmation systems, support and resistance indicators, market structure analyzers, or advanced trading dashboards, multi-timeframe development opens the door to more accurate and context-aware trading strategies.
By carefully managing timeframe relationships, data synchronization, performance optimization, and visual presentation, developers can create professional-grade cTrader indicators that help traders identify higher-probability opportunities while maintaining a clear view of overall market conditions.
As algorithmic trading continues to evolve, multi-timeframe indicators remain one of the most valuable tools for traders seeking a broader market perspective without sacrificing execution precision.
Building a Multi-Timeframe Simple Moving Average (SMA) Indicator for cTrader
Multi-timeframe (MTF) analysis is a cornerstone of professional trading. By observing a higher timeframe’s trend while executing on a lower timeframe, traders can filter out market noise and align themselves with major institutional momentum. While many trading platforms make multi-timeframe scripting cumbersome, cTrader and its C# API offer clean, robust abstractions to fetch and synchronize data across different time intervals seamlessly.
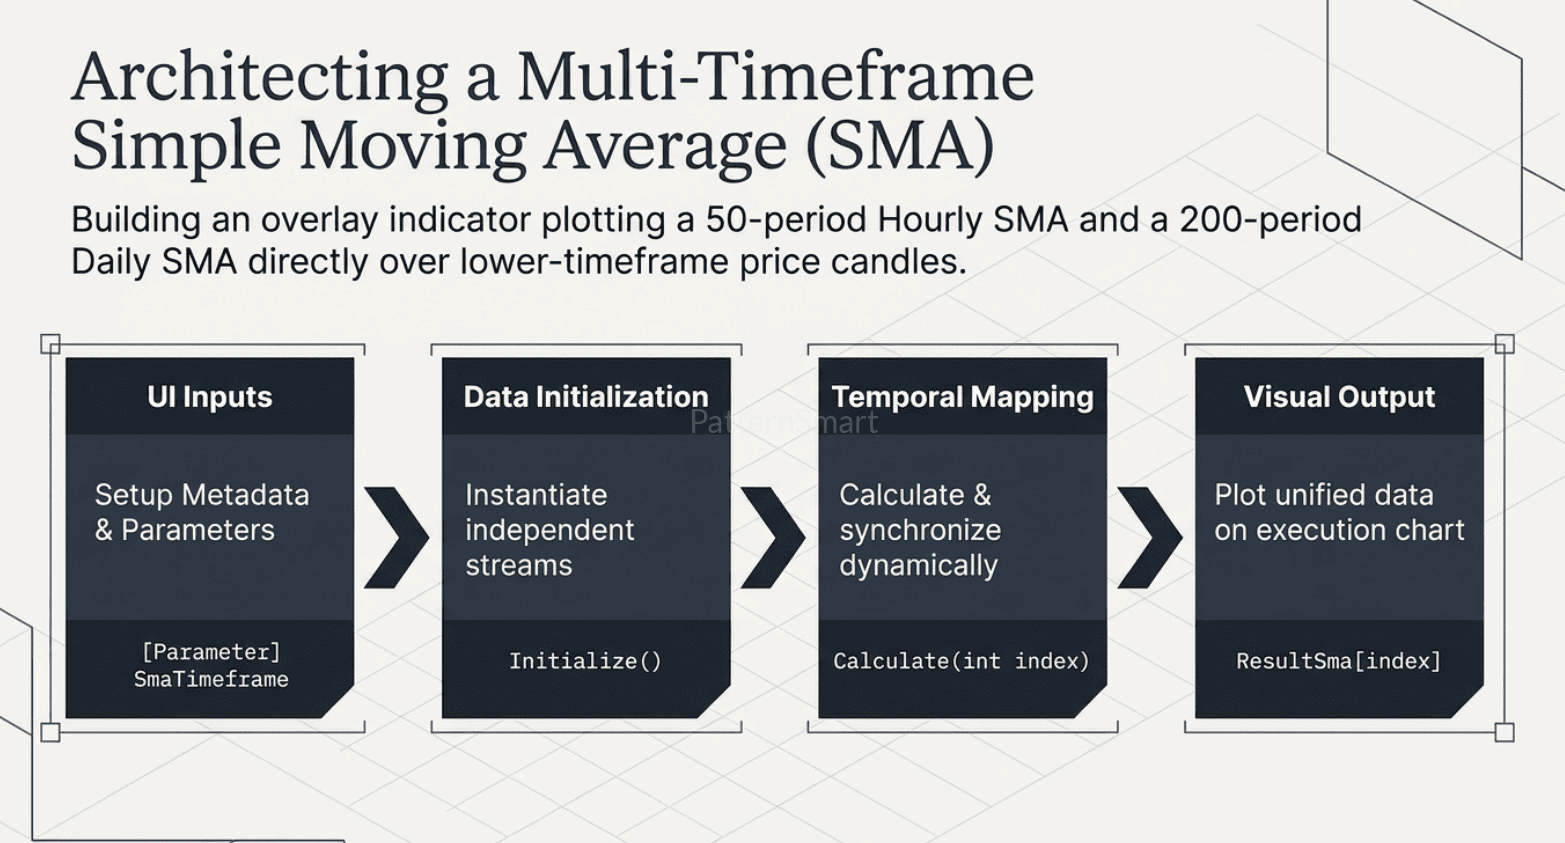
This article walks through the architecture, core methods, and implementation details required to build a custom Multi-Timeframe Simple Moving Average (SMA) indicator for cTrader.
The Core Challenge of Multi-Timeframe Scripting
When writing an indicator that runs on a 15-minute chart but calculates values based on a Daily timeframe, two primary engineering hurdles arise:
- Data Synchronization: A 15-minute candle and a Daily candle have completely different timestamp footprints. You cannot simply plug index
iof a 15-minute array into a Daily array without causing severe indexing errors or data misalignment. - Repainting and Continuity: Higher timeframe candles only update when they close. If you are halfway through a Daily candle, what value should your indicator display on the current lower timeframe chart?
cTrader solves these challenges natively using the MarketData API and temporal mapping functions.
Key cTrader APIs Used
Before looking at the full implementation, let’s highlight the two critical methods that make this indicator work:
MarketData.GetBars(TimeFrame timeframe): This method retrieves the historical and real-time live data stream for any standard or custom timeframe, completely independent of the chart timeframe the user currently has open.OpenTimes.GetIndexByTime(DateTime time): This function queries a higher timeframe’s open times array to find the exact index that corresponds to a specific timestamp on the current chart. This bridges the gap between different bar resolutions.
Step-by-Step Implementation Guide
1. Setting Up the Indicator Attributes and Parameters
Every cTrader indicator starts by defining its metadata using the [Indicator] attribute. We set IsOverlay = true so that our moving averages plot directly over the price candles rather than in a separate sub-window.
C#
using System;
using cAlgo.API;
using cAlgo.API.Internals;
using cAlgo.API.Indicators;

namespace cAlgo.Indicators
{
    [Indicator(IsOverlay = true, TimeZone = TimeZones.UTC, AccessRights = AccessRights.None)]
    public class MultiTimeframeSMA : Indicator
    {
        // SMA 1 Configuration
        [Parameter("SMA 1 Period", Group = "Moving Average 1", DefaultValue = 50)]
        public int Sma1Period { get; set; }

        [Parameter("SMA 1 Timeframe", Group = "Moving Average 1", DefaultValue = "Hour")]
        public TimeFrame Sma1Timeframe { get; set; }

        [Parameter("SMA 1 Color", Group = "Moving Average 1", DefaultValue = "DodgerBlue")]
        public Color Sma1Color { get; set; }

        // SMA 2 Configuration
        [Parameter("SMA 2 Period", Group = "Moving Average 2", DefaultValue = 200)]
        public int Sma2Period { get; set; }

        [Parameter("SMA 2 Timeframe", Group = "Moving Average 2", DefaultValue = "Daily")]
        public TimeFrame Sma2Timeframe { get; set; }

        [Parameter("SMA 2 Color", Group = "Moving Average 2", DefaultValue = "OrangeRed")]
        public Color Sma2Color { get; set; }
2. Declaring Outputs and Internal Variables
Next, we expose the calculation results to the cTrader UI via [Output] properties and declare internal variables to hold our higher timeframe bars and underlying SMA indicator instances.
C#
        [Output("SMA 1", LineColor = "DodgerBlue", Thickness = 2)]
        public IndicatorDataSeries ResultSma1 { get; set; }

        [Output("SMA 2", LineColor = "OrangeRed", Thickness = 2)]
        public IndicatorDataSeries ResultSma2 { get; set; }

        private Bars _bars1;
        private Bars _bars2;

        private SimpleMovingAverage _higherSma1;
        private SimpleMovingAverage _higherSma2;
3. Initializing Streams in Initialize()
The Initialize() method executes once when the indicator loads onto the chart. Here, we instantiate our higher timeframe bars using MarketData.GetBars() and feed their close prices into standard cTrader SimpleMovingAverage indicator wrappers.
C#
        protected override void Initialize()
        {
            _bars1 = MarketData.GetBars(Sma1Timeframe);
            _bars2 = MarketData.GetBars(Sma2Timeframe);

            _higherSma1 = Indicators.SimpleMovingAverage(_bars1.ClosePrices, Sma1Period);
            _higherSma2 = Indicators.SimpleMovingAverage(_bars2.ClosePrices, Sma2Period);
        }
4. Mapping and Calculating in Calculate()
The Calculate(int index) method runs for every bar on the chart. This is where temporal synchronization occurs.
We look up the open time of the current chart bar (Bars.OpenTimes[index]) within the higher timeframe’s open times. If an exact match is found, we map the higher timeframe value to our output series. If no match is found (meaning a higher timeframe bar hasn’t completed or opened yet for that specific timestamp), we forward-fill the previous valid value to maintain a smooth, continuous line without visual gaps.
C#
        public override void Calculate(int index)
        {
            // --- Process SMA 1 ---
            int index1 = _bars1.OpenTimes.GetIndexByTime(Bars.OpenTimes[index]);
            if (index1 != -1)
            {
                ResultSma1[index] = _higherSma1.Result[index1];
            }
            else if (index > 0)
            {
                // Forward fill if exact matching bar hasn't opened yet
                ResultSma1[index] = ResultSma1[index - 1];
            }

            // --- Process SMA 2 ---
            int index2 = _bars2.OpenTimes.GetIndexByTime(Bars.OpenTimes[index]);
            if (index2 != -1)
            {
                ResultSma2[index] = _higherSma2.Result[index2];
            }
            else if (index > 0)
            {
                // Forward fill
                ResultSma2[index] = ResultSma2[index - 1];
            }
        }
    }
}
Best Practices and Optimization Tips
- Avoid Repainting Pitfalls: By referencing historical open times via
GetIndexByTime, this method ensures that historical bars look at the exact higher-timeframe state that existed at that moment, avoiding future-leakage bugs. - Performance Considerations: Requesting multiple higher timeframe data streams via
MarketData.GetBarsis lightweight in cTrader, but avoid instantiating heavy nested loops inside theCalculatemethod to keep backtesting and real-time chart rendering lightning fast. - Extensibility: You can easily expand this script to include a third or fourth moving average, or modify it to calculate Exponential Moving Averages (EMA) or Relative Strength Index (RSI) using the exact same mapping framework.
If you are looking for advanced Multi-Timeframe Indicators , check out our full collection of MTF Related Trading Indicators.
Contact us if you are looking for Professional Custom Trading Software Development Services
