MACD Divergence: A Powerful Tool for Market Analysis
In the world of technical analysis, the Moving Average Convergence Divergence (MACD) divergence is a widely utilized and well-regarded indicator in the world of trading. It provides traders with valuable insights and enables them to make knowledgeable trading decisions. This indicator combines trend following and momentum-based signals to identify potential price trend reversals and trend continuation. This article will discuss the basics of MACD divergence and how traders use it to analyze the market.
What is MACD Divergence?
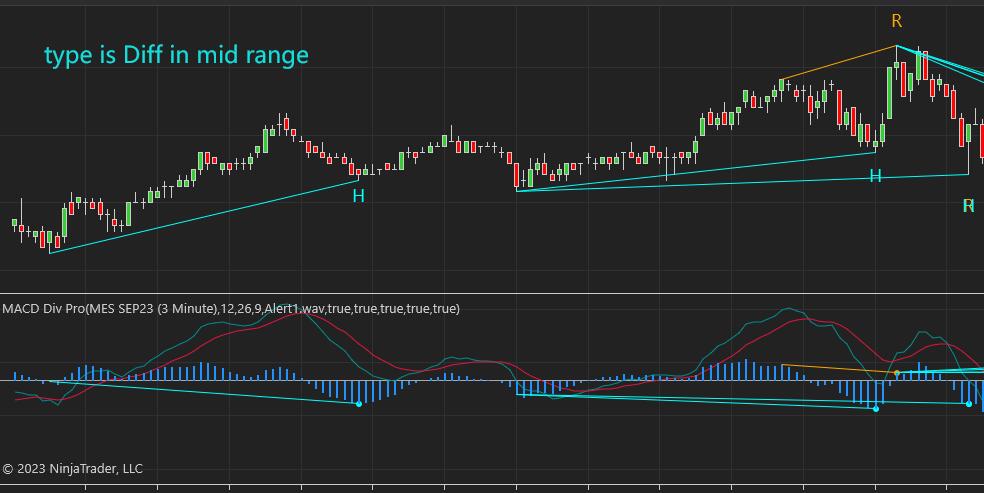
MACD divergence is a technical analysis tool that compares the price action of an asset to the behavior of its underlying momentum indicator, the MACD. When the price of an asset is making higher highs, but the MACD is making lower highs, it is said to be showing positive divergence. Conversely, when the price of an asset is making lower lows, but the MACD is making higher lows, it is considered a negative divergence.
The pic below is from our MACD divergence indicator with alert for NinjaTrader 8.

How Traders Use MACD Divergence
Traders use MACD divergence as a signal to buy or sell an asset based on the trend reversal or continuation of the price. Positive divergence indicates that the underlying momentum of the asset is bullish, suggesting that the price is likely to continue to rise. Negative divergence, on the other hand, suggests that the momentum is bearish, and the price is expected to keep dropping.
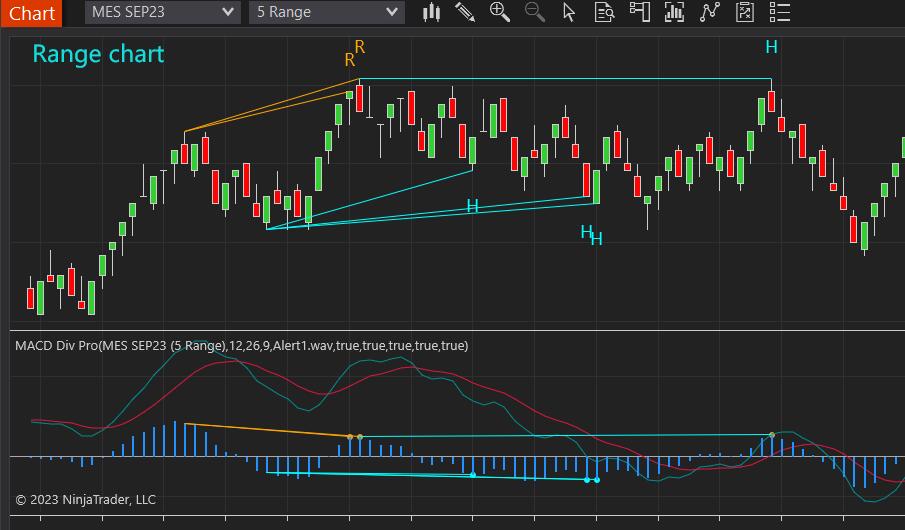
Another consideration for traders is the use of different types of MACD divergence, such as regular divergence and hidden divergence. In contrast to regular divergence, where the price of an asset and the MACD move in opposite directions, hidden divergence occurs when the price and the MACD move in the same direction but at varying speeds. Traders can also use hidden divergence to identify the potential continuation of a trend.
The pic below is from our MACD divergence indicator with alert for NinjaTrader 8.

Limitations
While the MACD divergence indicator can be useful in identifying market trends, it may also generate false signals, particularly in sideways markets. It is also sensitive to time frames and the selection of Moving average lengths. Different time frame settings can provide different signals, so it is wise to choose proper time frame that fits the trader’s trading style and market outlook. Lastly, like any other technical analysis tool, the MACD divergence indicator should not be relied upon as a standalone indicator but to be used together with other technical indicators, fundamental analysis, and risk management strategies.
Conclusion
The MACD divergence indicator is a crucial asset for traders seeking to make informed decisions in the financial market. By using a combination of tools and understanding different types of MACD divergence, traders can use this indicator to their advantage and succeed in the market.