NinjaTrader 8 ATR Percentile Regime Transition: Stateful Compression-to-Expansion Indicator
Advanced Trading Tutorial · NinjaTrader 8 · Free complete NinjaScript indicator
Volatility compression is not itself a trading signal. A market can remain quiet for many bars, and a single large candle does not prove that a durable expansion has begun. This tutorial builds a closed-bar, stateful volatility regime detector that remembers a compression event, waits for a later expansion, and checks directional evidence before placing a dot on the price chart. The main engineering lesson is how to preserve an event across bars without accidentally using future data or repeating a signal on every subsequent candle.
Why an event-driven design beats a one-bar condition
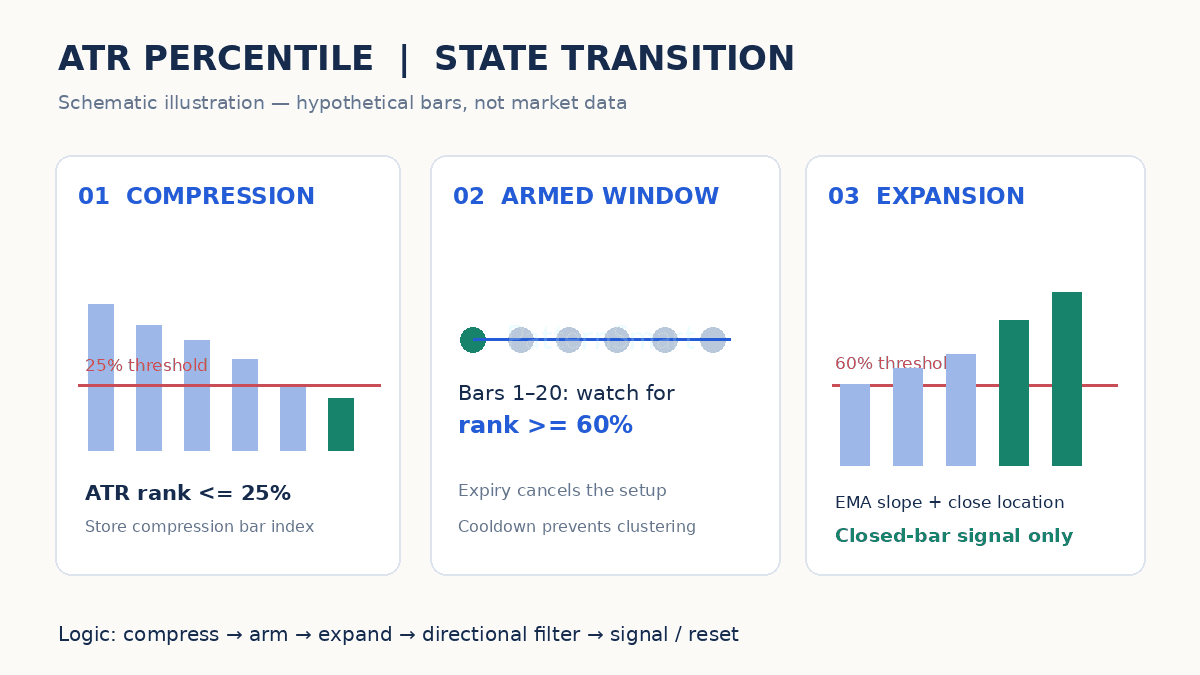
A naïve rule such as “ATR is high and price is above an EMA” measures the present but forgets the setup. The more useful question is whether the market was unusually quiet before the current expansion. This indicator therefore has three conceptual states: idle, armed after compression, and confirmed after a qualifying expansion. The watch expires after a configurable number of bars; a cooldown prevents clusters of near-identical dots.
The study deliberately generates observational signals, not orders. It is suitable for research, chart annotation, and as a starting point for a separately tested strategy. It does not calculate position size, stops, commissions, or slippage.
Define a percentile without looking ahead
Let A(t) be Wilder ATR(14) at the close of bar t. For a lookback of N=100, compare A(t) against the previous 100 ATR observations, A(t−1) through A(t−100). The percentile rank is 100 × (count of previous observations less than or equal to A(t)) / N. Excluding the current observation from the reference set makes the comparison explicit and repeatable. Ties are included; this matters for low-volatility or coarsely priced instruments.
Compression is registered when rank ≤25. The system remembers that bar and waits up to 20 later completed bars for rank ≥60. On that expansion bar, a bullish dot additionally requires close above EMA(34), EMA rising versus its previous value, and close location (close−low)/(high−low) ≥0.70. Bearish logic mirrors those conditions with a falling EMA and close location ≤0.30. Zero-range bars are ignored to avoid division by zero.
Worked example: the reference set matters
Suppose 100 historical ATR observations exist and exactly 21 are ≤ the current ATR of 1.20. Rank=21%, so bar 240 arms the detector. At bar 246, 67 of the preceding 100 ATR values are ≤ the new ATR of 1.65; rank=67%, satisfying expansion. Assume close=102.8, low=101.8, high=103.0: close location=(102.8−101.8)/(103.0−101.8)=0.833. If EMA(34) is 102.1 and its previous value is 102.0, a bullish dot appears two ticks below the bar low. If the EMA were flat, no dot would appear even though volatility expanded. These are hypothetical numbers, not a backtest.
Settings and trade-offs
| Input | Default | Interpretation |
|---|---|---|
| ATR Period | 14 | Smoothing horizon of true range |
| Rank Lookback | 100 | Historical comparison window, excluding current bar |
| Compression / Expansion | 25 / 60 | Low-rank arming and higher-rank confirmation |
| Arming Bars / Cooldown | 20 / 8 | Setup expiry and spacing between accepted signals |
| Trend EMA | 34 | Directional slope and price-location filter |
A longer rank window adapts more slowly after a structural volatility change. Raising the expansion threshold makes signals rarer but can delay recognition. Shortening the arming window requires faster transitions. The thresholds are research hypotheses, not universally optimal settings. Test them across instruments and market regimes rather than optimizing to one sample.
Complete NinjaScript C# indicator
Create a new indicator named PSVolatilityRegimeTransition and replace its generated code with the complete listing below. The script uses the standard NT8 OnStateChange lifecycle, instantiates ATR/EMA in State.DataLoaded, and evaluates the signal once per completed bar using Calculate.OnBarClose. Two plots expose bull and bear dots, using double.NaN on nonsignal bars. The state variables persist while the indicator processes bars.
// NT8 closed-bar volatility compression/expansion state machine
// Indicator: PSVolatilityRegimeTransition
#region Using declarations
using System;
using System.ComponentModel;
using System.ComponentModel.DataAnnotations;
using System.Windows.Media;
using NinjaTrader.NinjaScript;
using NinjaTrader.NinjaScript.Indicators;
using NinjaTrader.Gui.Chart;
#endregion

namespace NinjaTrader.NinjaScript.Indicators
{
    public class PSVolatilityRegimeTransition : Indicator
    {
        private ATR atr;
        private EMA ema;
        private int armedBar = -1;
        private int lastSignalBar = -100000;

        [NinjaScriptProperty]
        [Range(2, 100)]
        [Display(Name = "ATR Period", Order = 1, GroupName = "Parameters")]
        public int AtrPeriod { get; set; }

        [NinjaScriptProperty]
        [Range(20, 500)]
        [Display(Name = "Rank Lookback", Order = 2, GroupName = "Parameters")]
        public int RankLookback { get; set; }

        [NinjaScriptProperty]
        [Range(1, 100)]
        [Display(Name = "Compression Percentile", Order = 3, GroupName = "Parameters")]
        public int CompressionPercentile { get; set; }

        [NinjaScriptProperty]
        [Range(1, 100)]
        [Display(Name = "Expansion Percentile", Order = 4, GroupName = "Parameters")]
        public int ExpansionPercentile { get; set; }

        [NinjaScriptProperty]
        [Range(1, 100)]
        [Display(Name = "Arming Bars", Order = 5, GroupName = "Parameters")]
        public int ArmingBars { get; set; }

        [NinjaScriptProperty]
        [Range(1, 100)]
        [Display(Name = "Cooldown Bars", Order = 6, GroupName = "Parameters")]
        public int CooldownBars { get; set; }

        [NinjaScriptProperty]
        [Range(2, 200)]
        [Display(Name = "Trend EMA", Order = 7, GroupName = "Parameters")]
        public int TrendEma { get; set; }

        protected override void OnStateChange()
        {
            if (State == State.SetDefaults)
            {
                Description = "Closed-bar ATR percentile compression-to-expansion detector.";
                Name = "PSVolatilityRegimeTransition";
                Calculate = Calculate.OnBarClose;
                IsOverlay = true;
                IsSuspendedWhileInactive = true;
                AtrPeriod = 14;
                RankLookback = 100;
                CompressionPercentile = 25;
                ExpansionPercentile = 60;
                ArmingBars = 20;
                CooldownBars = 8;
                TrendEma = 34;
                AddPlot(Brushes.LimeGreen, PlotStyle.Dot, "BullSignal");
                AddPlot(Brushes.IndianRed, PlotStyle.Dot, "BearSignal");
            }
            else if (State == State.DataLoaded)
            {
                atr = ATR(AtrPeriod);
                ema = EMA(TrendEma);
            }
        }

        protected override void OnBarUpdate()
        {
            Values[0][0] = double.NaN;
            Values[1][0] = double.NaN;
            int warmup = Math.Max(RankLookback + AtrPeriod + 1, TrendEma + 2);
            if (CurrentBar < warmup || High[0] <= Low[0])
                return;

            // Compare today's ATR against PREVIOUS RankLookback ATR values.
            // Ties count as lower-or-equal, making the percentile deterministic.
            double currentAtr = atr[0];
            if (currentAtr <= 0)
                return;
            int lessOrEqual = 0;
            for (int i = 1; i <= RankLookback; i++)
                if (atr[i] <= currentAtr)
                    lessOrEqual++;
            double percentile = 100.0 * lessOrEqual / RankLookback;

            // A compression bar arms a finite-lived watch window.
            if (percentile <= CompressionPercentile)
                armedBar = CurrentBar;

            if (armedBar < 0)
                return;
            if (CurrentBar - armedBar > ArmingBars)
            {
                armedBar = -1;
                return;
            }
            // Never trigger on the same compression bar.
            if (CurrentBar == armedBar || percentile < ExpansionPercentile)
                return;
            if (CurrentBar - lastSignalBar < CooldownBars)
                return;

            double closeLocation = (Close[0] - Low[0]) / (High[0] - Low[0]);
            bool bull = Close[0] > ema[0] && ema[0] > ema[1]
                && closeLocation >= 0.70;
            bool bear = Close[0] < ema[0] && ema[0] < ema[1]
                && closeLocation <= 0.30;
            if (bull)
                Values[0][0] = Low[0] - TickSize * 2;
            else if (bear)
                Values[1][0] = High[0] + TickSize * 2;
            else
                return;

            lastSignalBar = CurrentBar;
            armedBar = -1;
        }
    }
}
Install, inspect and validate
- In NinjaTrader 8, open New → NinjaScript Editor, right-click Indicators and create the named indicator.
- Replace the template with the full code, compile in NinjaScript Editor, then add the indicator to a chart with sufficient historical bars.
- Start with a liquid instrument and a consistent bar type; compare a 5-minute and a 15-minute chart rather than assuming the same parameters transfer.
- Inspect individual historical bars: manually count ATR rank for a small test sample, confirm that compression precedes expansion, and verify EMA slope and close location.
- Check that the indicator produces no dot on zero-range bars, does not emit signals on the compression bar, respects the 20-bar expiry and the 8-bar cooldown, and behaves consistently after reload.
What can go wrong?
Percentile instability: when the ATR distribution changes abruptly, a rolling historical rank can remain elevated for an extended period. Bar-close latency: confirmation arrives only after the candle finishes, so a fast move may already be underway. Chart dependence: time, tick and range bars generate different ATR distributions. History and warmup: early bars are intentionally ignored until sufficient observations exist. State continuity: a chart reload recalculates state from loaded history, and insufficient loaded history can change the first available signal. Execution gap: an indicator dot is not a fillable trade; spreads, slippage, market hours and risk limits require separate analysis.
This example has not been compiled or tested inside a live NinjaTrader installation; review API compatibility and compile before using it. For systematic evaluation, compare a fixed parameter set across out-of-sample periods, record false positives and missed expansions, and avoid selecting parameters solely on attractive historical charts. No signal guarantees profitability.
Interested in adapting this free indicator to additional session filters, alerting or strategy integration? Explore our Custom Trading Software Development Services to discuss your requirements.