Volume Confirmation in Breakouts: Why Relative Participation Matters More Than One Big Bar
A breakout occurs when price moves beyond a previously observed boundary, but crossing a line is not the same as sustaining a new trading range. Volume can help describe participation during that transition. It cannot, by itself, prove that a breakout will continue.
1. What volume actually measures
Exchange-traded share volume counts shares traded over a specified period. Futures volume counts contracts. Spot foreign-exchange feeds may provide tick volume rather than centralized transaction volume. Never compare unlike measures as if they were identical. A high-volume bar indicates activity, not whether buyers or sellers were more aggressive in net terms: each executed trade has both a buyer and a seller.
2. Absolute volume versus relative volume
A volume bar of 500,000 shares may be extraordinary for one instrument and ordinary for another. A simple relative-volume measure is RVOL = current completed bar volume / average volume of comparable completed bars. If the reference mean is 200,000 shares and the current completed bar is 320,000, RVOL = 1.60. This means 60% more volume than the selected baseline, not a 60% higher probability of success.
For intraday bars, compare the same time-of-day interval across previous sessions to account for the open and close volume pattern. For daily bars, use a consistent trailing window, excluding the current bar from the reference average. Do not treat a partially formed bar as directly comparable with completed bars.
3. Two contrasting breakout structures
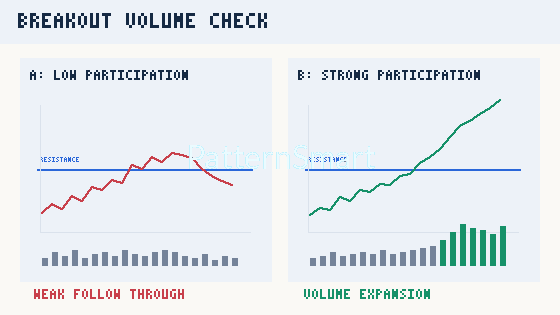
The figure intentionally contrasts a weak follow-through and a stronger continuation. In practice, a high-volume breakout can fail through exhaustion, news reversals, stop runs or poor liquidity. Conversely, a low-volume breakout can continue when supply is scarce. Volume is contextual evidence, not a standalone entry trigger.
4. A reproducible confirmation checklist
- Define resistance before the event. Use a prior consolidation high or a well-documented zone, not a level chosen after seeing the outcome.
- Specify the price condition. For example, require a completed bar to close above the zone, not merely wick through it.
- Specify the participation comparison. For example, RVOL above 1.3 relative to the previous 20 comparable completed bars. The number is a hypothetical screening parameter, not a universal threshold.
- Observe acceptance. Does the next bar hold above the zone, or does price immediately close back inside?
- Define invalidation and costs. Account for spread, slippage, fees, overnight gaps and a maximum acceptable loss before considering a trade.
5. Worked hypothetical example
Suppose an instrument trades in a 98–100 range. Its last 20 comparable completed bars average 120,000 shares. A completed bar closes at 100.40 with 180,000 shares, giving RVOL = 180,000 / 120,000 = 1.50. This meets a predeclared 1.3 screening condition. A subsequent close at 99.70, however, would place price back below the former 100 boundary, weakening the breakout thesis. An RVOL of 1.50 does not override that price failure.
6. Common analytical mistakes
Lookahead bias: computing a baseline with future bars or confirming a breakout before the bar closes. Session mismatch: comparing a 9:30 a.m. volume spike with a midday average. Data mismatch: mixing adjusted and unadjusted feeds or treating broker tick volume as consolidated market volume. Selection bias: tuning the RVOL cutoff on the same examples used to claim an edge. Confirmation bias: ignoring a quick return below resistance because the breakout bar had unusually high volume.
7. Turning the idea into a testable process
Define the breakout boundary, baseline window, trading session, bar-close rule, invalidation, entry timing and transaction costs before evaluating historical samples. Separate training and out-of-sample periods, examine different volatility regimes, and report both failed and successful signals. If you want to implement consistent session-matched volume calculations or alerts, our Custom Trading Software Development Services can help translate clearly specified research rules into software.
Conclusion
Relative volume makes breakout participation more interpretable than a raw bar count. The strongest analytical approach combines a predefined price level, completed-bar confirmation, a comparable volume baseline, follow-through assessment and explicit invalidation. None guarantees continuation.
Risk disclaimer: This article is educational, not personalized financial advice. Trading involves losses, including losses beyond intended stop levels due to gaps and slippage. Test methods independently and assess suitability before risking capital.