Every algorithmic trader has experienced this moment: You spend hours coding a new custom indicator, plug it into a backtester, and the equity curve shoots up like a rocket. It looks flawless. You have seemingly discovered the holy grail of trading systems.
Then, you deploy it live, and it immediately loses money.
The most common culprit behind this heartbreak is look-ahead bias. This occurs when an indicator or trading strategy accidentally incorporates information from the future to make a decision in the present.
In a backtest, the historical data is already fully populated. Because the future data points are physically sitting right there in your data frame or array, it is dangerously easy to write code that unintentionally reads forward. When your model “cheats” by peaking at what happens next, the backtest results become utterly detached from reality.
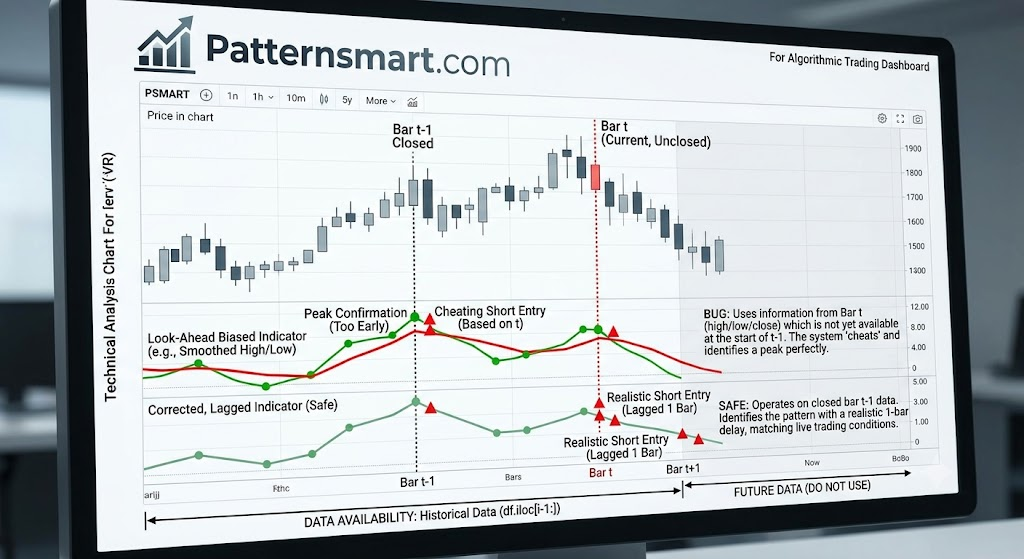
1. The Anatomy of a Leak: Common Coding Pitfalls
Look-ahead bias rarely happens intentionally; it is almost always a subtle coding oversight. Below are the three most frequent ways future data leaks into custom indicators.
A. The “Current Bar Close” Real-Time Illusion
When coding an indicator inside a loop or a rolling calculation, it is easy to forget that a bar’s Close, High, and Low prices are completely unknown until that bar actually finishes forming.
If you write a strategy that calculates an indicator using the Close of the current candle, and then triggers an execution at the Open of that exact same candle, you have committed look-ahead bias. You are executing a trade based on a closing price that wouldn’t actually exist for another hour, day, or minute.
B. Index Shifting Mistakes (The Pandas -1 Trap)
In Python (Pandas), shifting a dataset is a common way to align data points. However, a simple sign error can break your model:
Python
# DANGEROUS: Leaks future data into the present
df['future_signal'] = df['close'].shift(-1)

# SAFE: Moves past data forward to prevent look-ahead
df['past_signal'] = df['close'].shift(1)
Using a negative integer inside .shift() pulls the next row’s data backward in time. If your indicator relies on df['close'].shift(-1), it is reading tomorrow’s price today.
C. The Zig-Zag and Peak-Detection Fallacy
Indicators that plot structural swing highs and swing lows (like the Zig-Zag indicator or polynomial smoothing filters) are notorious look-ahead engines if coded poorly. To confirm that a specific point is a “local peak,” the algorithm must wait a few bars to ensure the price drops lower.
If your code marks a peak immediately on the exact bar where it occurs, the backtester will execute a flawless short trade at the absolute top. In reality, you wouldn’t know it was the top until three bars later.
2. Platform-Specific “Gotchas”
Different development environments handle time-series data uniquely. Understanding how your specific environment indexes data is critical to avoiding leaks.
| Platform / Language | Common Culprit | Technical Mechanism |
| Python / Pandas | df.iloc[i] loops or custom functions without strict rolling windows | Accessing an absolute index position i + n during a historical iteration loop. |
| Pine Script (TradingView) | The security() function | Fetching higher timeframe data (e.g., daily data on a 15-minute chart) without setting the barmerge.lookahead_off flag. |
| MQL4 / MQL5 | iClose() or CopyClose() functions | Passing an absolute historical shift index that hasn’t officially closed on lower-tier asynchronous data streams. |
3. Best Practices to Protect Your Code
To ensure your trading indicators remain completely blind to the future, implement these defensive programming habits.
1.Shift Signals Explicitly:Step 1.
Always lag your signals. If an indicator evaluates at the close of Bar $t$, the earliest a trade can possibly execute in the real world is at the open of Bar $t+1$. Make sure your execution arrays reflect this one-bar delay.
2.Truncate Your Evaluation Window:Step 2.
When writing custom mathematical transformations, smoothing, or matrix operations, pass only sliced historical data up to index $i$ to the function. Never pass the entire dataframe if the function uses global normalization or multi-period center-moving averages.
3.Enforce Strict ‘Closed-Bar’ Logic:Step 3.
If you are building an intraday or multi-timeframe strategy, restrict the indicator to run its calculations only when a bar’s volume or time status transitions to ‘closed’.
4. How to Stress-Test and Debug Your Indicator
If your backtest results look too good to be true, you need to actively try to break your indicator to see if it’s cheating. Here are two highly effective stress tests:
The Ghost Data Test: Insert a massive, artificial price spike (e.g., a 500% jump) into a single historical bar in the middle of your dataset. Check the indicator values for the 5 bars prior to that spike. If the indicator values change or start moving upward before the spike actually happens, your code has a look-ahead leak.
The Live vs. Historical Sanity Check
Run your indicator in a live paper-trading environment or on a real-time, tick-by-tick chart simulator for a few hours. Record the exact indicator values it outputs in real-time.
Later, reload that exact same historical time window from your database and recalculate the indicator over it. Compare the two outputs side-by-side.
- If the values match perfectly, your code is secure.
- If the historical calculation looks cleaner, smoother, or generates signals earlier than the live capture did, you have look-ahead bias buried in your math.
Building robust indicators requires an obsession with chronological data integrity. By treating historical data points as a strictly forward-moving conveyor belt where the future remains completely invisible, you ensure that your backtest performance translates accurately to live market conditions.
Contact us if you are looking for Professional Custom Trading Software Development Services