1. Introduction & Key Takeaways
In modern systematic trading, isolating true structural shifts from temporary market noise requires cross-timeframe structural alignment. This technical analysis provides a deep dive into the USDJPY currency pair utilizing cTrader‘s advanced Chart Typologies. By deploying a multi-range framework combined with the volume-neutralized Momentum Double Divergence indicator and the volatility-based Trend Pullback Reversal (TPR) indicator, we reveal a high-probability macro bearish setup developing across shifting cyclical boundaries.
- Macro Bearish Dominance: The long-range structural anchor remains locked in a firm downtrend, with recent price action confirming a hidden bearish reversal at key dynamic resistance.
- Execution Realignment: While shorter-range structural horizons previously printed local hidden bullish structures, the mid-range structural block has officially broken beneath its dynamic support zone, confirming a structural trend flip.
- Institutional Volume Acceleration: The momentum oscillator validates structural exhaustion on rallies, providing low-risk institutional entry parameters aligned with the primary macro decline.
2. Multi-Chart Deep Dive
Chart 1: Macro Context (Long Range Horizon)
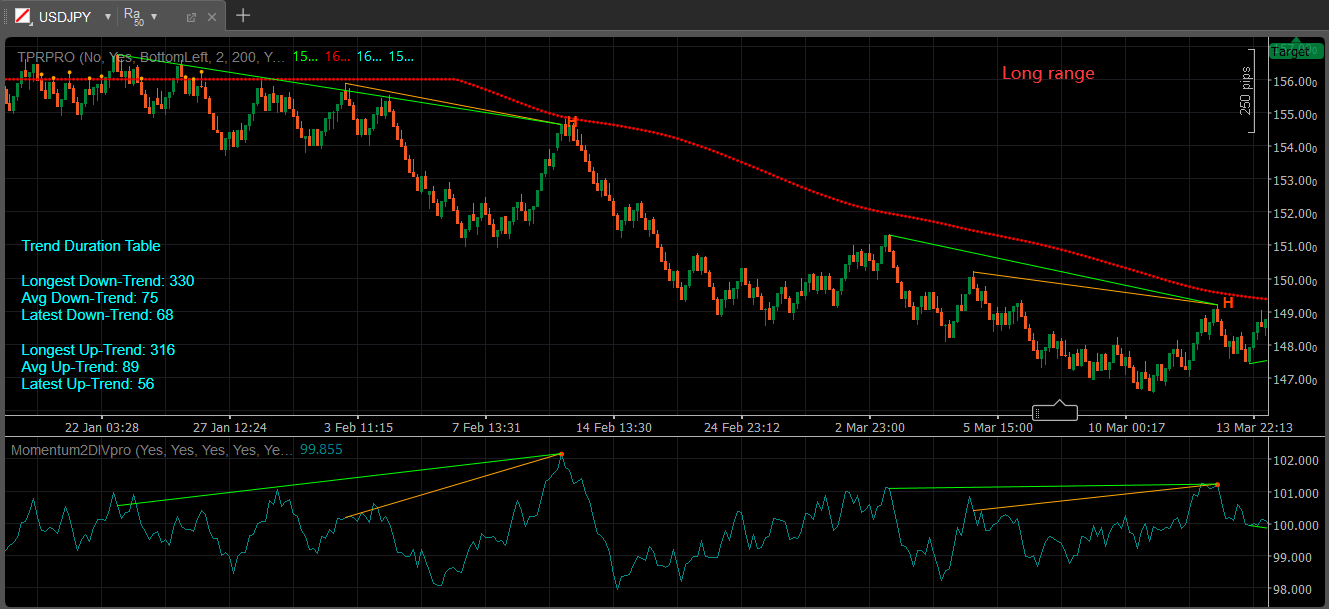
As observed on the long-range cTrader chart (referenced as the long range chart), the macro trend for USDJPY is decisively controlled by sellers. The Trend Pullback Reversal (TPR) indicator displays a well-established, downward-sloping red trend line, serving as an institutional dynamic resistance boundary.
The structural centerpiece of this chart is the validation of a clean hidden bearish divergence (marked by the orange and green structural trend lines and labeled H). While price formed a structural lower high relative to the early February swing peaks, the Momentum Double Divergence indicator pushed into an overextended state, printing a distinctive higher high. This structural velocity exhaustion indicates that the corrective rally lacked genuine institutional buying power. The immediate bearish rejection away from the red TPR line confirms that macro trend followers are actively defending this structural zone.
Chart 2: Intermediate Structural Transition (Mid Range Horizon)
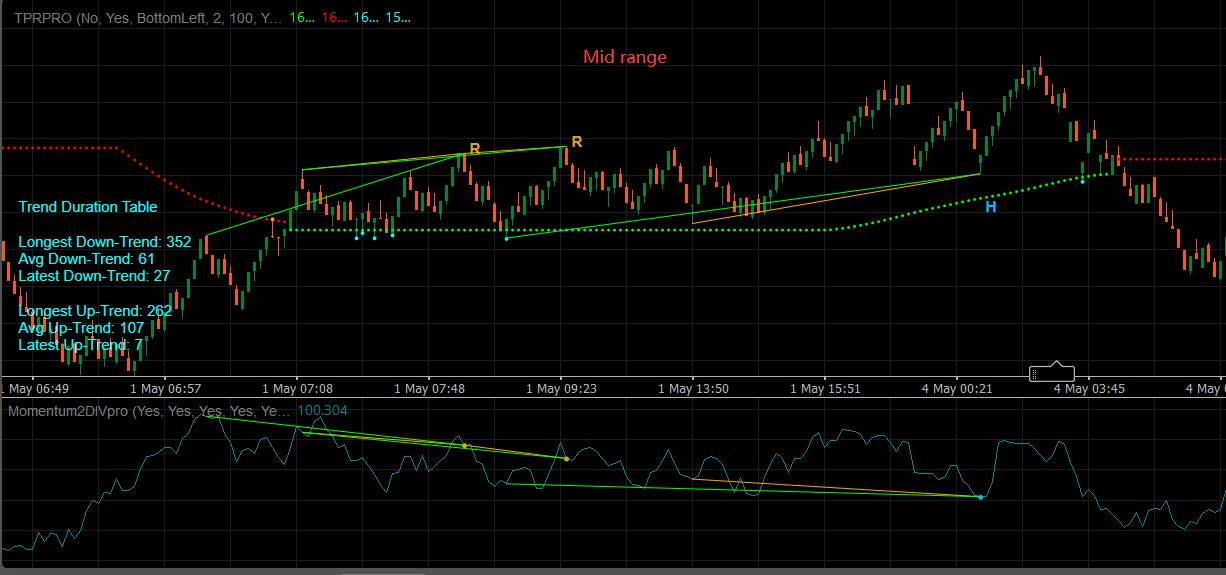
Transitioning into the mid-range operational framework (referenced as the mid range chart), we witness the precise mechanics of a structural trend reversal. Initially, this structural block established an uptrend, characterized by a green TPR line and supported by successive hidden bullish divergence clusters.
However, as price reached its terminal upside targets, a clear regular bearish divergence executed near the peaks (marked by R). The momentum oscillator printed lower highs while price pushed to equal or slightly higher structural nominal peaks. This momentum decay culminated in a aggressive breakdown below the green TPR line, which has now flipped to a red trend line at the far right edge of the execution screen. This transition formally invalidates the local bullish structure and aligns the mid-range horizon with the macro bearish trend.
Chart 3: Tactical Execution Framework (Short Range Horizon)
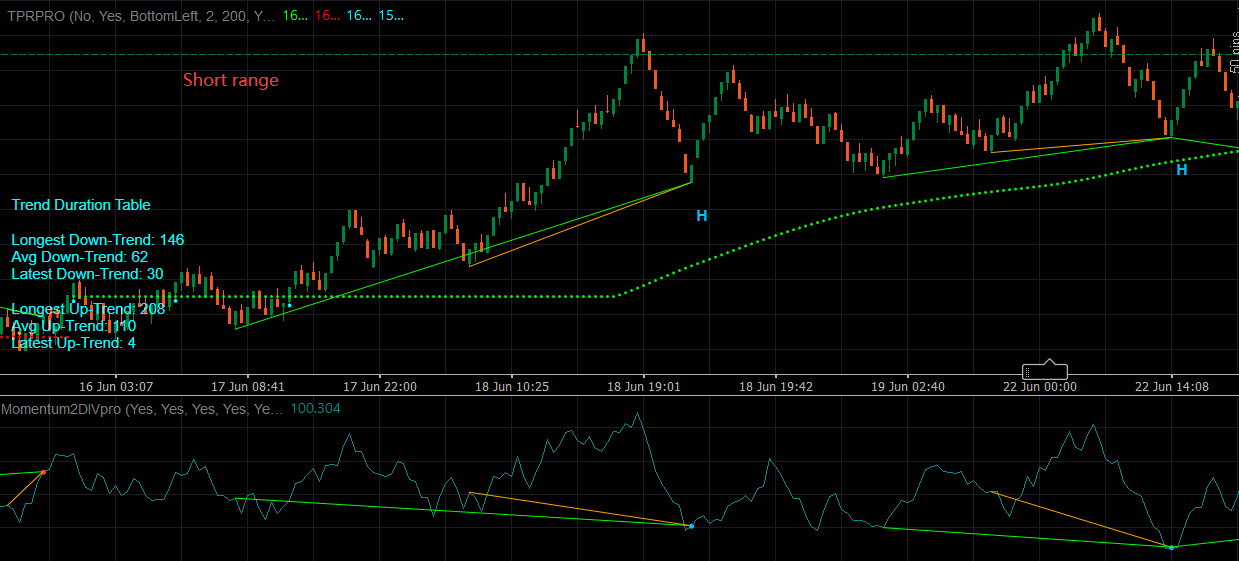
On the tactical short-range chart (referenced as the short range chart), the market displays minor structural intraday noise within the broader bearish regime. Here, the short-term TPR line remains green, reflecting a localized upward correction driven by a series of hidden bullish variations (H) within the Trend Duration Table metrics.
The Latest Up-Trend count sits at a nascent stage, demonstrating a brief momentum expansion. However, in an institutional top-down framework, short-range hidden bullish signals that drive price directly into major macro resistance (the red TPR line identified on the long-range chart) are not viewed as buy triggers. Instead, they are classified as overextended pullback cycles that offer premium short-side pricing.
3. Trading Setup & Risk Management
      [Macro Red TPR Resistance Zone ~ 149.500]
                    ▲
                    │  (Corrective Pullback Exhaustion)
                    │
      [Bearish Entry Trigger: Mid-Range Red Flip ~ 148.200]
                    │
                    ▼
      [Target 1: Short-Range Swing Low ~ 146.500]
                    │
                    ▼
      [Target 2: Macro Structural Target ~ 144.000]
- Tactical Entry Execution: Short positions are ideally executed upon confirmation of the mid-range trend flip, specifically as price actions break key local supports around the 148.200 region, aligning the short, mid, and long-range horizons into a unified bearish cascade.
- Invalidation / Stop-Loss Placement: The structural invalidation level is strictly defined just above the macro hidden bearish divergence peak and the long-range red TPR resistance line, placed firmly at 150.100. A daily close above this level invalidates the structural thesis.
- Downside Targets:
- Take Profit 1: 146.500 (Prior structural support cluster and short-range swing lows).
- Take Profit 2: 144.000 (Major macro expansion target calculated from the long-range structural breakdown).
- Read the master guide on the Double Divergence Indicator Series.
- Visit the Technical Inputs Manual: Double Divergence Pro for full parameter tuning.
- The Momentum Double Divergence Pro indicator is available in these platforms: Ctrader, MetaTrader(MT4, MT5), NinjaTrader 8, MultiCharts, MultiCharts x.NET, Tradingview(subchart only), Prorealtime(subchart only), SierraChart.
- Introduction to the Trend Pullback Reversal (TPR) Indicator