In financial markets, volatility is cyclical. It continuously oscillates between two primary phases: compression (consolidation) and expansion (trend). Volatility compression represents a period where price action tightens, market participants reach a temporary equilibrium, and energy builds up within a narrow range.
For systematic and technical traders, detecting compression is one of the most reliable ways to anticipate explosive breakout moves. This article breaks down the mechanics of volatility compression and the core technical metrics used to detect it before expansion occurs.
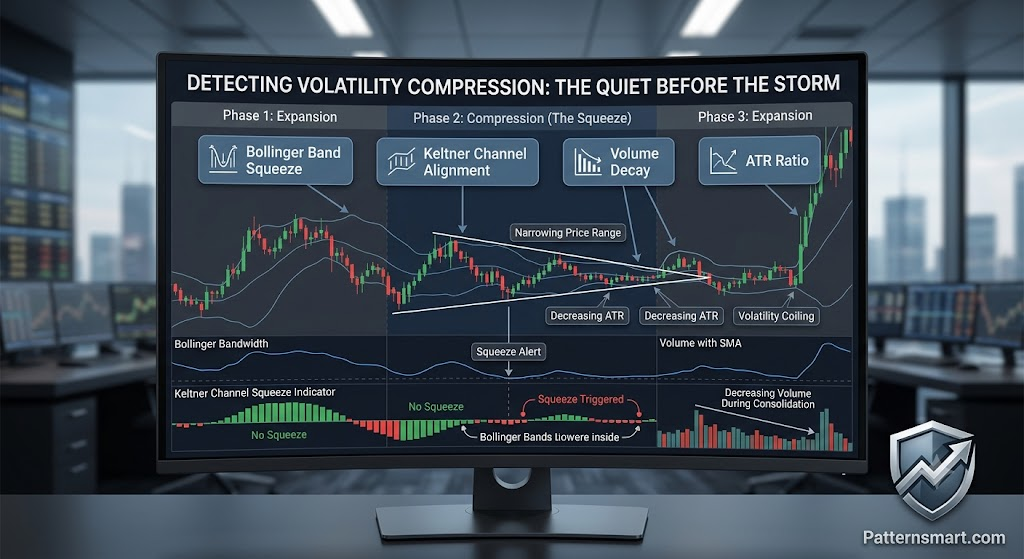
1. Mathematical and Statistical Indicators
The most objective way to measure compression is through statistical indicators that track price deviation or standard deviation over a fixed lookback period.
Bollinger Band Squeeze
Bollinger Bands measure market volatility by placing bands at a specific number of standard deviations (typically $$2\sigma$$) away from a Simple Moving Average (SMA).
- The Mechanics: During a compression phase, the standard deviation of price drops drastically, causing the upper and lower bands to contract toward the moving average.
- The Metric: To quantify this objectively, traders use Bandwidth (or Bollinger Bandwidth):
$$\text{Bandwidth} = \frac{\text{Upper Band} – \text{Lower Band}}{\text{SMA}}$$
- Detection: A volatility compression is confirmed when the Bandwidth drops to a multi-period low (e.g., its lowest level in 120 bars).
The Keltner Channel Alignment (The Squeeze Indicator)
John Carter popularized combining Bollinger Bands with Keltner Channels to identify compression.
- The Logic: Bollinger Bands adapt to volatility based on standard deviation, whereas Keltner Channels use the Average True Range (ATR).
- Detection: When volatility drops significantly, the Bollinger Bands will physically enter inside the Keltner Channels. This signifies extreme compression. Once the Bollinger Bands punch back outside the Keltner Channels, the compression is breaking, and a volatility expansion phase has begun.
2. Structural and Price Action Patterns
If you prefer analyzing the raw geometry of a chart, volatility compression manifests as highly recognizable structural footprints.
Chart Pattern Geometry
- Triangles (Symmetrical & Ascending/Descending): A symmetrical triangle is the visual definition of compression. Each successive peak is lower than the last, and each successive trough is higher, trapping price in a narrowing wedge.
- Flags and Pennants: After a sharp, vertical price expansion (the flagpole), the market undergoes a brief, tight compression phase (the flag) where volume dries up before the next leg.
Average True Range (ATR) Compression
The Average True Range tracks the absolute range of a candle (High minus Low, factoring in any gaps).
- When a market compresses, the daily or intra-day ranges shrink.
- Tracking an ATR Ratio (e.g., comparing a short-term 5-period ATR against a long-term 50-period ATR) allows you to mathematically pinpoint when current candle ranges are abnormally small relative to historical norms.
3. Order Flow and Volume Dynamics
Pure price metrics tell only half the story; true structural compression requires confirmation from volume and market liquidity.
Volume Decreasing During Consolidation
During a healthy volatility compression phase, transaction volume should steadily decline.
- Why? It indicates that buyers and sellers have agreed on a fair price for the moment, and speculative interest has temporarily paused.
- The Sign: A sharp breakout on low volume is prone to failing (a fakeout). A breakout supported by an immediate, massive spike in volume confirms that the compression phase has officially ended and institutions are aggressively positioning for the expansion phase.
Market Profile: High-Volume Nodes (HVN)
In Market and Volume Profile analysis, compression creates a prominent High-Volume Node (HVN) and a highly stable Point of Control (POC). This indicates that a massive amount of volume is being transacted within a very narrow price shelf. The longer the market remains balancing at this node, the more explosive the breakout tends to be when price finally migrates away from it.
Algorithmic Summary for Indicator Logic
If you are writing custom indicator code (e.g., in C#, Pine Script, or C++) to track and auto-detect compression, your script should look for three concurrent conditions:
| Metric | Compression Condition | Reason |
| Bollinger Bandwidth | Drops below its 20-period historical low or a fixed threshold. | Standard deviation is bottoming out. |
| BB / Keltner Relationship | UpperBB < UpperKeltner AND LowerBB > LowerKeltner | Price variation is tighter than the underlying ATR envelope. |
| Volume Filter | 5-period Volume SMA is below the 30-period Volume SMA. | Confirms a lack of aggressive participation prior to the breakout. |
By building multi-faceted alert logic that pairs statistical narrowing (Bandwidth) with structural verification (ATR/Volume), you can systematically remove the guesswork from identifying trading environments primed for a massive directional trend expansion.
Contact us if you are looking for Professional Custom Trading Software Development Services