The Boundaries of Algorithmic Logic: Identifying When an Indicator Fails
In technical analysis, the quest for the ultimate indicator often blinds traders to a fundamental reality: indicators are mathematical transformations of price, volume, and time; they are not crystal balls. Every indicator is engineered with specific mathematical assumptions about how a market behaves. When the market regime shifts outside of those assumptions, the indicator’s predictive value drops to zero—or worse, becomes highly deceptive.
For systematic traders and strategy developers, knowing when to turn an indicator off is arguably more profitable than knowing when to follow its signals. This article explores how to identify when an indicator is fundamentally mismatched with current market conditions.
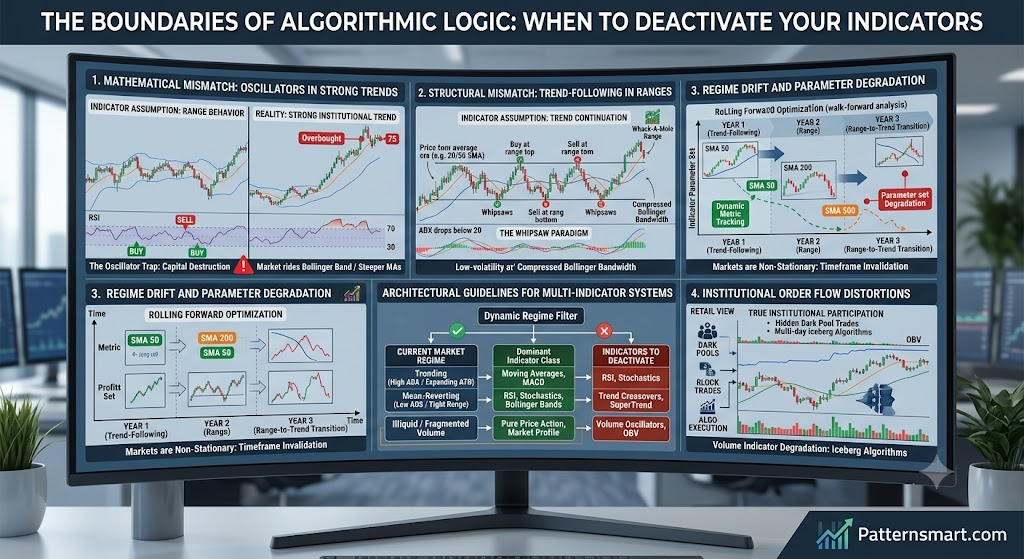
1. Mathematical Mismatch: Oscillators in Strong Trends
The most common indicator failure occurs when traders apply mean-reversion tools to a strong momentum environment.
The Oscillator Trap
Oscillators like the Relative Strength Index (RSI), Stochastics, or the Commodity Channel Index (CCI) are mathematically bound between fixed boundaries (e.g., 0 to 100). They are designed to identify exhaustion by measuring velocity and price variance within a defined range.
- The Failure Mode: In a strong, institutional-driven trend, an asset can remain “overbought” or “oversold” for weeks or months.
- The Math Behind It: The formula for standard RSI compares the magnitude of recent gains to recent losses. In a persistent bull run, down-bars are shallow and rare, keeping the numerator heavily weighted.
- The Diagnostic: If the market enters a high-momentum regime—characterized by price riding the upper Bollinger Band or a steepening moving average ribbon—oscillators should not be used for counter-trend signals. They become instruments of capital destruction.
[RSI Hits 75 (Overbought)]
       ↓
[Trader Shorts Market] ➔ [Trend Continues Upward]
       ↓
[RSI Flags Divergence] ➔ [Trend Steepens Further]
       ↓
Result: The indicator fails because the market shifted from Range to Trend.
2. Structural Mismatch: Trend-Following Filters in Whack-A-Mole Ranges
Conversely, trend-following indicators like the Moving Average Convergence Divergence (MACD), Moving Average crossovers, and SuperTrend fail spectacularly when a market loses direction.
The Whipsaw Paradigm
Trend indicators rely on directional inertia. Mathematically, they use smoothing techniques (lags) to filter out short-term noise, expecting that a direction, once established, will persist.
- The Failure Mode: When a market enters a low-volatility, mean-reverting trading range (compression or balance), these indicators lag behind the turning points.
- The Diagnostic: A moving average crossover will buy exactly at the top of the range and sell exactly at the bottom of the range, repeatedly generating “whipsaws.”
- When to Deactivate: If the Average Directional Index (ADX) drops below 20, or if the Bollinger Bandwidth is severely compressed, trend-following indicators must be sidelined. The market lacks the structural inertia they require to function.
3. Regime Drift and Parameter Degradation
Markets are non-stationary systems. The underlying cycles, volatility, and participation rates change constantly. An indicator parameter set that worked perfectly during one year may fail completely the next due to “regime drift.”
Timeframe and Cycle Invalidation
Indicators that rely on fixed lookback periods (e.g., a 14-period ATR or a 50-period SMA) assume that market cycles are static.
- The Failure Mode: If an asset’s average cycle length changes—perhaps shifting from a 20-day cycle to a 60-day cycle due to macroeconomic changes or a transition from retail to institutional dominance—a 14-period lookback becomes mathematically arbitrary noise.
- The Diagnostic: Track the indicator’s performance metrics dynamically via rolling forward optimization (walk-forward analysis). If the profit factor or win rate drops significantly below historical standard deviations while the broader market benchmark remains steady, the indicator’s parameters have degraded.
4. Institutional Order Flow Distortions
Some indicators rely heavily on secondary market data, such as volume or open interest. While incredibly useful, these can be distorted by institutional mechanics.
Volume Indicator Degradation
Indicators like On-Balance Volume (OBV) or the Volume Accumulation/Distribution index assume that volume ticks directly reflect aggressive buying or selling pressure.
- The Failure Mode: In modern electronic markets, massive institutional orders are frequently routed through dark pools, block trades, or executed using multi-day iceberg algorithms (VWAP/TWAP).
- The Diagnostic: This off-exchange or highly smoothed execution fragments the volume signature on retail feeds. If a security shows a significant price trend but volume-based indicators remain completely flat or move counter to the trend without a valid structural reason, the volume feed is likely failing to capture true institutional participation.
Architectural Guidelines for Multi-Indicator Systems
To prevent your trading systems from executing signals during an indicator’s failure phase, implement a Regime-Filter Architecture in your code:
| Current Market Regime | Dominant Indicator Class | Indicators to Deactivate |
| Trending (High ADX / Expanding ATR) | Moving Averages, MACD, Ichimoku Kinko Hyo | Counter-trend Oscillators (RSI, Stochastics) |
| Mean-Reverting (Low ADX / Tight Range) | RSI, Stochastics, Bollinger Bands (for boundaries) | Trend Crossovers, SuperTrend, Parabolic SAR |
| Illiquid / Fragmented Volume | Pure Price Action, Market Profile TPOs | Volume Oscillators, Chaikin Money Flow, OBV |
By wrapping your execution logic in conditional switches that evaluate the macro environment before taking an indicator’s signal seriously, you safeguard your capital against structural blind spots.
Contact us if you are looking for Professional Custom Trading Software Development Services