Dynamic Market Structure: Why Support and Resistance Zones Shift
In classical technical analysis, horizontal lines are often drawn across historical price peaks and troughs, treating support and resistance as static boundaries. While this approach looks clean on a historical chart, live market participants quickly realize a fundamental truth: support and resistance zones are dynamic, evolving structures.
Markets change because the collective behavior, capital allocation, and risk tolerance of the players inside them change. Understanding why these structural zones shift over time is critical for transition from rigid chart patterns to fluid market profile logic.
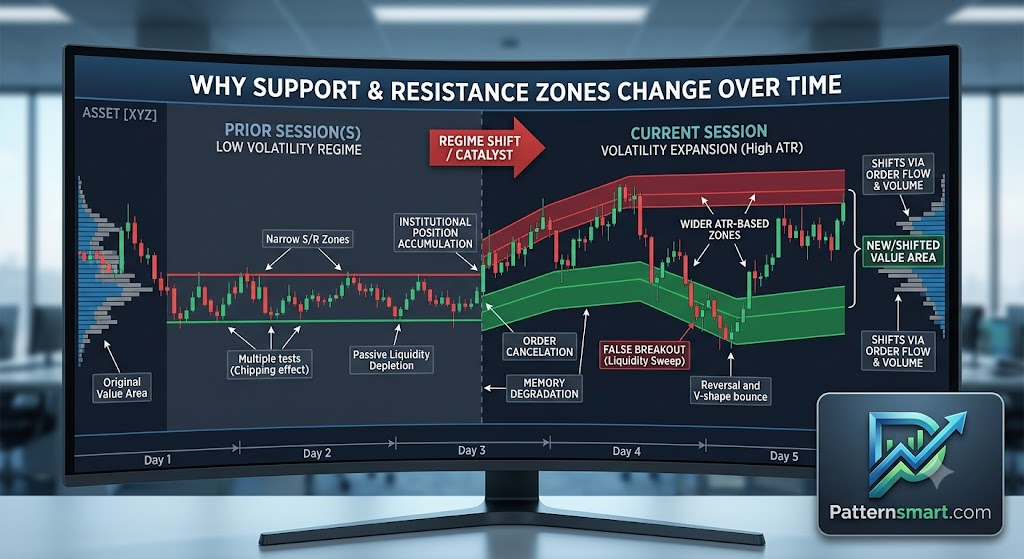
1. The Psychology of the Order Book (Order Flow Dynamics)
To understand why a zone shifts, we must look beneath the candlesticks at the underlying order book. Support and resistance zones exist because of a concentration of limit orders and institutional liquidity. As time passes, this layout naturally degrades and reforms.
Liquidity Exhaustion (“The Chipping Effect”)
When a price level is tested repeatedly, its strength often diminishes rather than reinforces. Every time a support zone is hit, a portion of the available buy limit orders (passive liquidity) is filled.
- The First Test: High concentration of buyers; price bounces aggressively.
- Subsequent Tests: If new buyers do not step in to reload the order book, the existing passive liquidity gets chipped away.
- The Shift: Once exhausted, the zone fails, and the market searches deeper for the next pocket of liquidity, moving the structural level lower.
Order Cancellation and Spoilage
Limit orders are not set-and-forget instructions for institutions. Large market makers and algorithmic execution algorithms continuously recalculate risk based on current volatility, time of day, and macroeconomic factors. A support zone that was heavily backed by institutional buy limits at 10:00 AM might be completely pulled (canceled) by 2:00 PM because the broader market regime shifted.
2. Institutional Mechanics and Position Accumulation
Large-scale market participants (hedge funds, central banks, asset managers) cannot deploy capital instantly without causing massive, unfavorable slippage. Their execution mechanics naturally distort static zones.
Order Splitting and VWAP/TWAP Execution
An institution looking to buy 5 million shares will spread their orders over hours, days, or weeks, often targeting a Volume-Weighted Average Price (VWAP) or using Time-Weighted Average Price (TWAP) algorithms.
- Because these execution targets adjust dynamically as trading volume and time accumulate throughout the day, the institutional “floor” (support) moves along with the algorithm’s updated target, shifting the physical zone where heavy buying occurs.
Stop-Hunting and Liquidity Sweeps
Retail trading logic dictates placing stop-loss orders just outside highly visible, static support or resistance lines. Institutional algorithms exploit this predictability.
They will intentionally drive prices past a known support zone to trigger a cluster of sell stops. This “liquidity sweep” allows institutions to fill massive buy orders against those forced sellers. Once the sweep is complete, price swiftly reverses. On a chart, this looks like a broken zone that suddenly re-established itself slightly lower.
3. Market Regime Shifts and Volatility Expansion
Support and resistance zones are highly dependent on the market’s current volatility regime. When volatility changes, the width and placement of these zones must adapt.
ATR-Driven Expansion
During periods of low volatility (compression), support and resistance zones can be incredibly narrow and precise. However, when an asset transitions into a high-volatility regime (expansion), price swings become wider.
- A zone that was 5 ticks wide during a consolidation period may need to widen to 20 or 30 ticks to accommodate the expanded Average True Range (ATR).
- If you do not adjust the zone width relative to current volatility, static lines result in frequent false breakouts (“whipsaws”).
[Low Volatility Regime]   -->  Precise, narrow S/R zones (Tight trading ranges)
          ↓
[Regime Shift / Catalyst] -->  Volatility expansion (ATR triples)
          ↓
[High Volatility Regime]  -->  Zones widen, absorb larger price swings, or shift entirely
4. The Time Degradation of Memory
The psychological significance of a price level degrades over time. Human traders and historical algorithms have a recency bias.
- Recent Zones: A high formed two days ago has immense psychological weight because traders who are currently trapped in losing positions are waiting for price to return to that exact level to break even.
- Aged Zones: A resistance level formed two years ago carries significantly less weight. The majority of the market participants who traded that specific level have long since closed their positions, rolled their options contracts, or updated their risk parameters.
As old participants exit and new capital enters, the market’s collective memory resets, rendering old static lines obsolete while new, modern zones form based on recent volume concentration.
Technical Summary for System Designers
When developing automated indicators or algorithmic strategies to map these zones, relying on fixed price points introduces structural fragility. To build robust models, support and resistance should be calculated using dynamic inputs:
- Volume Profile / Market Profile (TPOs): Focus on the Value Area (VA) and Point of Control (POC) rather than raw price peaks. Pockets of high volume dictate true structural support/resistance, and these pockets shift as new volume prints.
- Volatility-Adjusted Banding: Utilize ATR or standard deviation bands (like Bollinger Bands or Keltner Channels) to dynamically expand or contract the boundaries of a zone based on live market conditions.
- Time-Weighting: Implement a decay factor in your structural detection code so that older pivot points lose relevance over time compared to high-volume zones formed within recent trading sessions.
Contact us if you are looking for Professional Custom Trading Software Development Services