Learn how to turn a NinjaScript custom indicator into a NinjaTrader 8 Market Analyzer column, scan futures watchlists, highlight signals, and manage performance.

A futures trader may have a dozen contracts on a watchlist, but opening a chart for each one just to check a moving-average condition is slow and repetitive. A NinjaTrader custom Market Analyzer column solves that problem by putting a custom indicator’s latest value beside each instrument in one live scanner. NinjaTrader’s Market Analyzer is designed to scan multiple instruments against criteria you define, and its standard Indicator column can host indicators—including custom NinjaScript indicators.
The practical shortcut is important: for many trading rules, you do not need to code a separate Market Analyzer column class. Build an indicator that exposes a clear numeric plot, then add that indicator through the Market Analyzer’s built-in Indicator column. A dedicated custom column is useful when you need a specialized text value, data type, or custom-drawn display that an indicator plot cannot provide.
What your scanner column should return
A chart indicator can draw lines or shapes for visual analysis. A Market Analyzer column needs a compact value that is easy to compare across instruments. Before writing code, define the output contract. For example:
1means the fast moving average is above the slow moving average.-1means the fast moving average is below the slow moving average.0means there is not yet enough data to calculate a valid state.
That encoding makes the same logic usable across a whole futures watchlist. You can display the numeric result, color positive and negative values, filter rows, or sort the grid by the value.
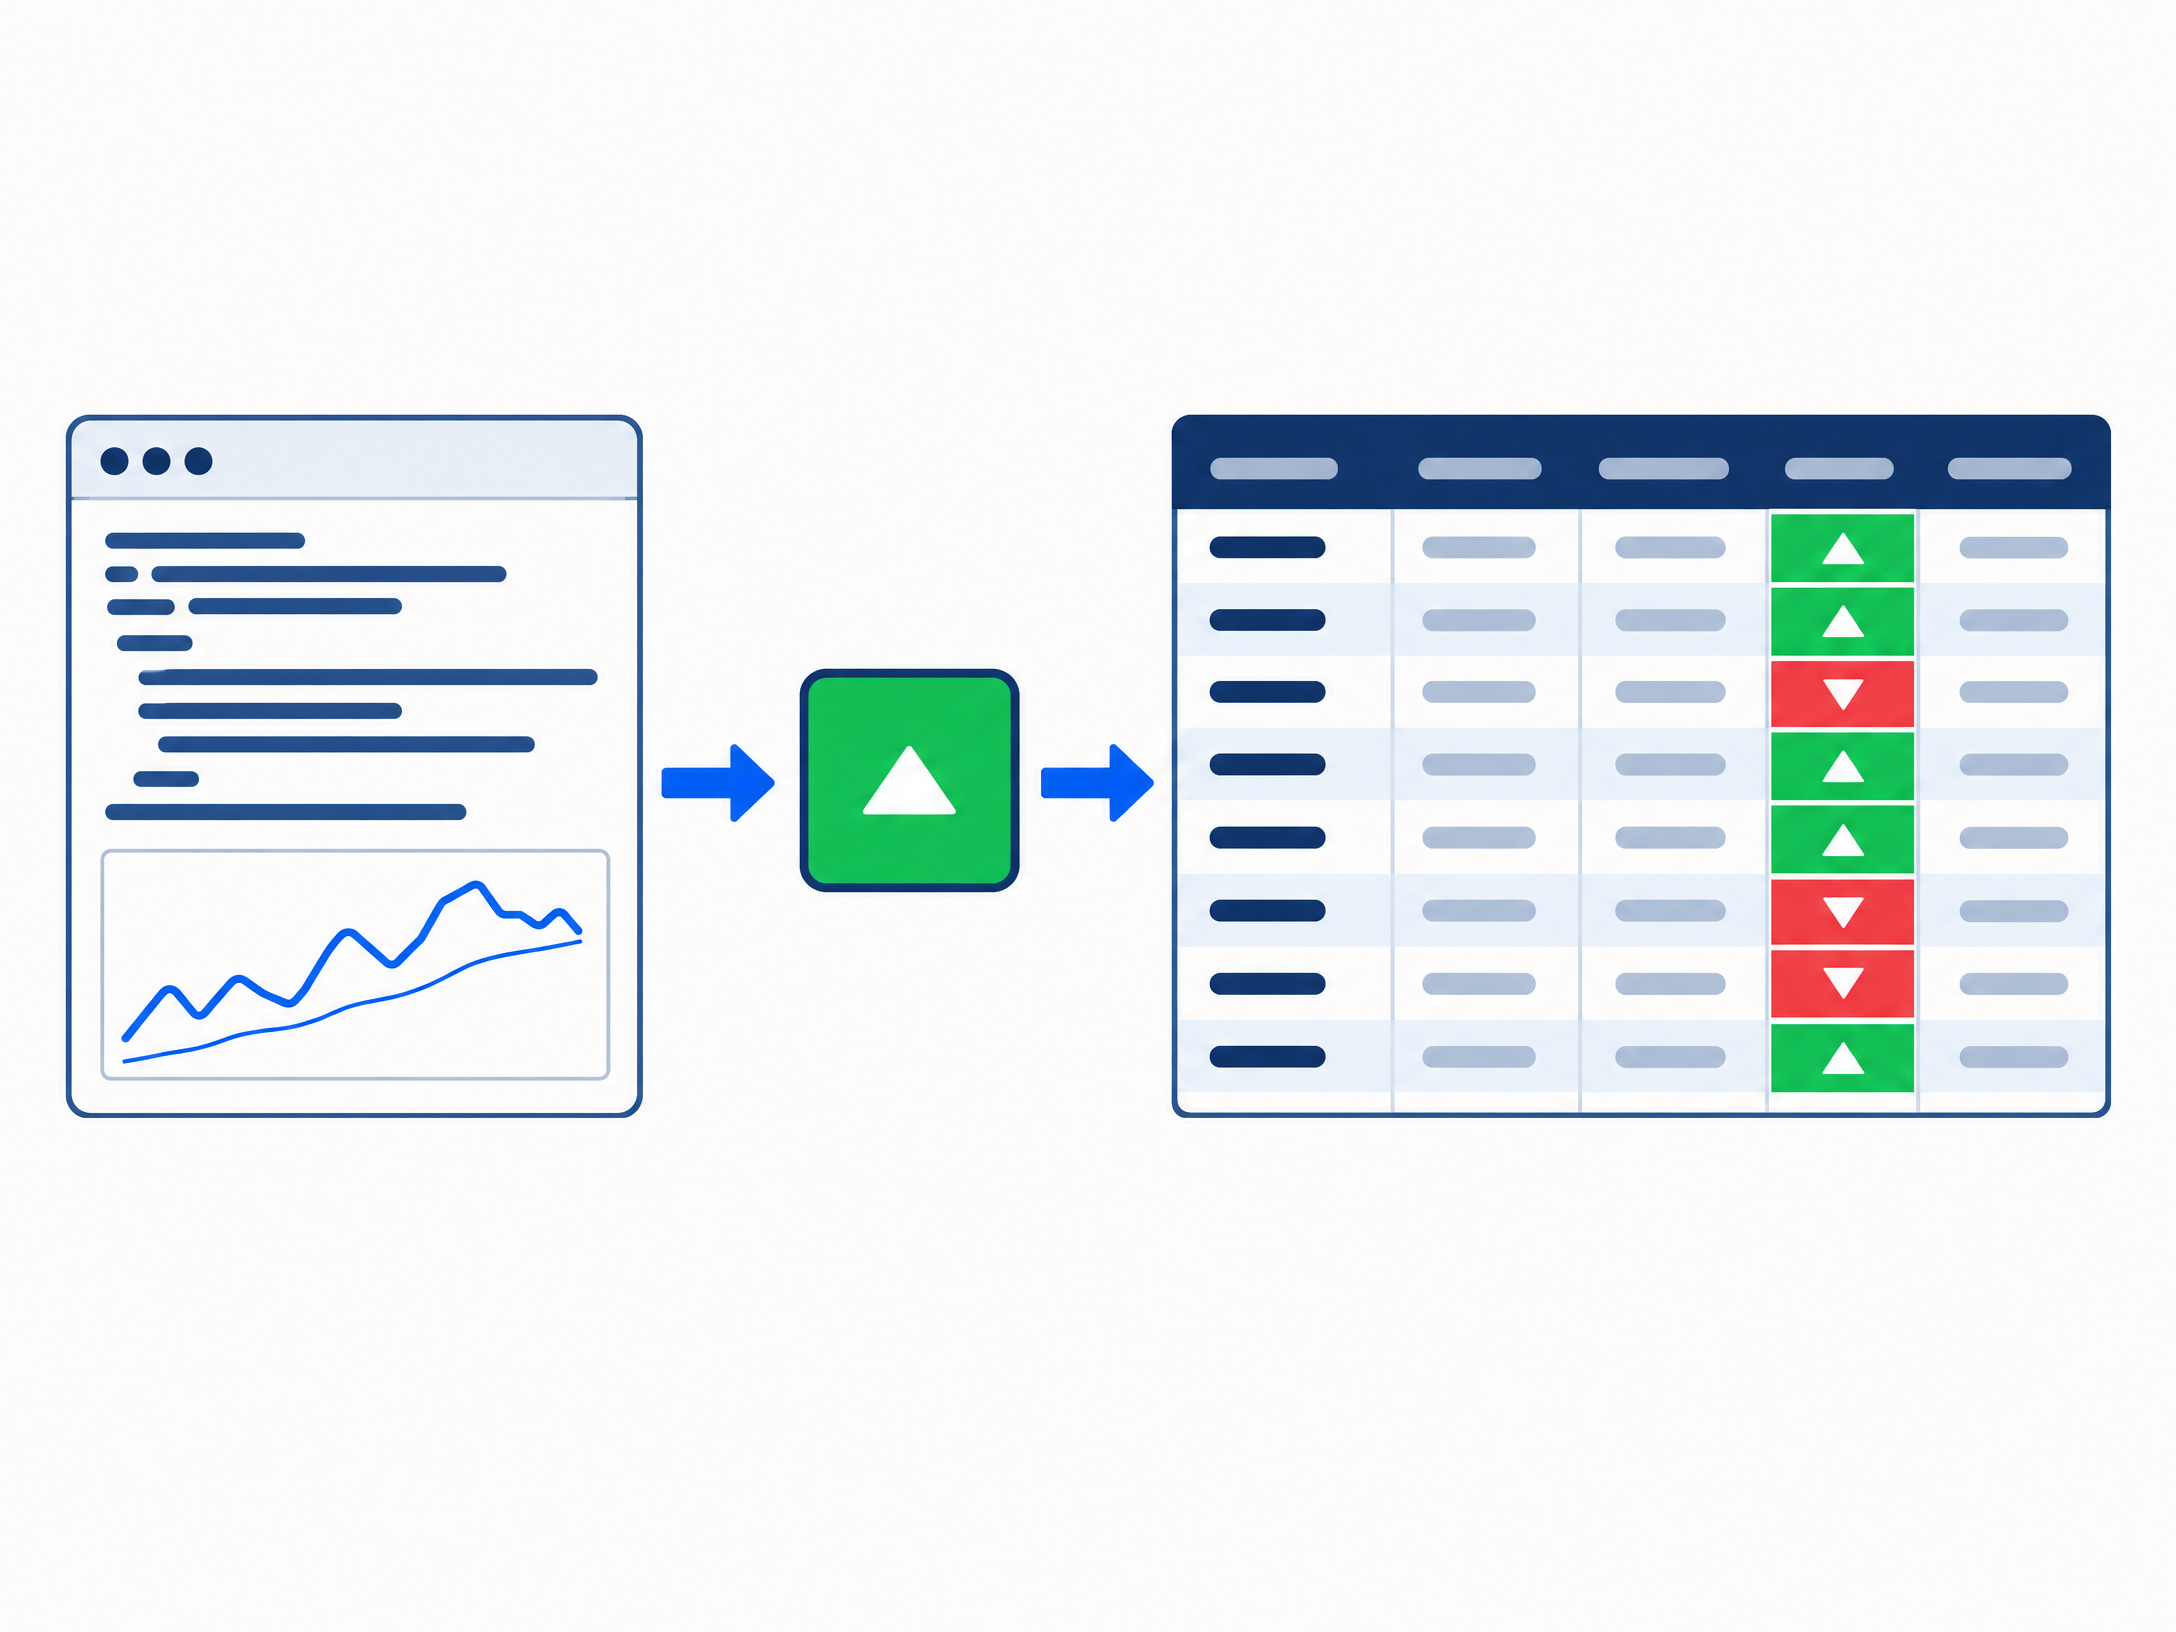
Build a simple NinjaScript custom indicator
This example creates a 9/21 EMA bias indicator. It returns 1 when the 9-period exponential moving average is above the 21-period EMA and -1 when it is below. It returns 0 during the initial warm-up bars. The indicator adds a named plot called Bias, which is the plot you will select in the Market Analyzer.
Create a new indicator in the NinjaScript Editor, replace the generated indicator class body with the following code, then save and compile. If you are editing a Wizard-generated file, keep any required generated code that NinjaTrader maintains for the indicator wrappers.
#region Using declarations
using System.ComponentModel.DataAnnotations;
using System.Windows.Media;
using NinjaTrader.NinjaScript;
using NinjaTrader.NinjaScript.Indicators;
#endregion

namespace NinjaTrader.NinjaScript.Indicators
{
    public class MovingAverageBias : Indicator
    {
        private EMA fastEma;
        private EMA slowEma;

        protected override void OnStateChange()
        {
            if (State == State.SetDefaults)
            {
                Name = "MovingAverageBias";
                Description = "Returns 1 when the fast EMA is above the slow EMA and -1 when it is below.";
                Calculate = Calculate.OnBarClose;
                IsOverlay = false;

                FastPeriod = 9;
                SlowPeriod = 21;

                AddPlot(Brushes.RoyalBlue, "Bias");
            }
            else if (State == State.DataLoaded)
            {
                fastEma = EMA(FastPeriod);
                slowEma = EMA(SlowPeriod);
            }
        }

        protected override void OnBarUpdate()
        {
            if (FastPeriod >= SlowPeriod || CurrentBar < SlowPeriod - 1)
            {
                Value[0] = 0;
                return;
            }

            Value[0] = fastEma[0] > slowEma[0] ? 1 : -1;
        }

        [NinjaScriptProperty]
        [Range(1, int.MaxValue)]
        [Display(Name = "Fast period", Order = 1, GroupName = "Parameters")]
        public int FastPeriod { get; set; }

        [NinjaScriptProperty]
        [Range(1, int.MaxValue)]
        [Display(Name = "Slow period", Order = 2, GroupName = "Parameters")]
        public int SlowPeriod { get; set; }
    }
}
The AddPlot call declares the Bias output in State.SetDefaults; NinjaTrader stores indicator plot values in its Values series, and Value[0] writes to the first plot. The two EMA instances are created after the data is loaded, which is the lifecycle stage NinjaTrader documents for initializing data-dependent indicator objects.
The example intentionally uses Calculate.OnBarClose, so the state updates after a bar closes. If your rules need intrabar updates, you can choose On price change or On each tick in the column’s setup. Those settings can make the displayed state more responsive, but tick-by-tick calculation uses more CPU and may show a condition that changes before the bar closes.
Important: This is an example of a state column, not an entry or exit order system. A moving-average relationship alone does not establish whether a trade is suitable. Test the logic against the instruments, bar types, sessions, and data you intend to use.
Add the indicator to a Market Analyzer
After the script compiles, create or open a Market Analyzer window. Add the futures instruments you want to monitor as rows. Then right-click the grid and choose Columns.
Add the built-in Indicator column. Select the new MovingAverageBias indicator in its properties, and choose the Bias plot. Set the input series, bar type, interval, price basis, trading-hours template, and historical load range to match the rule you actually intend to monitor. NinjaTrader exposes these controls because the bar series and amount of history affect the resulting indicator value.2
For a 1-minute setup, for instance, set the column to the intended 1-minute bar series and load enough bars for the 21-period EMA to initialize. Apply the column and confirm that its values make sense on a chart for a few instruments before relying on the full scanner. A chart and a Market Analyzer column can be configured with different intervals or session templates, so matching the settings is part of verifying that both views represent the same calculation.
You can then add cell conditions so positive values show in green and negative values show in red. If you want the grid to show only bullish states, create a filter condition that hides rows when Bias is less than 1, then turn on row filtering. Conditions can alter cell colors and text; filters can remove rows from the grid according to the column’s value.
When a custom Market Analyzer column class makes sense
Use the built-in Indicator column when your scanner needs to display a plot value from a custom NinjaScript indicator. This is the most direct option for values such as an oscillator reading, a volatility measure, a trend state, or a numeric pattern score.
A separately coded Market Analyzer column is the better fit when the output is not naturally an indicator plot—for example, when you need custom text, a different data type, or a custom-drawn graphic in each cell. NinjaTrader’s custom column API includes members for the displayed text and value, and it also supports custom rendering. Keeping the calculation in a reusable indicator and letting the analyzer display its plot is often simpler when the same calculation should also appear on charts.
Multi-timeframe and multi-instrument logic
NinjaTrader supports custom multi-series indicators as well as indicators used in Market Analyzer columns.3 That makes it possible to design a column around a rule that references more than one series, but it also adds synchronization work. A multi-series script receives updates from each Bars object, so its logic must account for the active series and available bar counts. Additional series are configured in State.Configure; NinjaTrader advises against choosing those series dynamically from runtime values.
For a multi-timeframe signal, define which series controls the final output, what counts as a synchronized confirmation, and how to behave when one series has not yet produced enough bars. Test the result in the analyzer and on a chart using matching series and trading-hours settings. If your requirement spans several timeframes, instruments, or session rules, treat it as a small scanner specification rather than assuming that adding another EMA call will resolve the timing details.
Keep NinjaTrader scanner development responsive
A column can be correct and still be frustrating if it takes too long to load. Start with only the instruments and indicator columns you need. Increase the historical load range only when the calculation requires it. NinjaTrader notes that indicator initialization time is multiplied across instruments, and that larger history ranges increase data-loading time and memory use. OnEachTick also uses more processor resources than OnBarClose.
For a practical rollout, add the column to a small test list first. Confirm the output, then expand to your full watchlist while observing load time and CPU use. If you plan to sort continuously, avoid an unnecessarily short auto-sort interval on a large grid; frequent sorting can add processor load.
If you want to turn an existing rule into a reusable indicator, custom scanner, alert system, or Market Analyzer column, see PatternSmart’s Custom Trading Software Development Services and NinjaTrader 8 Custom Programming Services. The service page describes custom indicators, market screeners, watchlist and Market Analyzer columns, and NinjaTrader development.