Why Does the Same Trading Indicator Produce Different Results on Different Platforms?
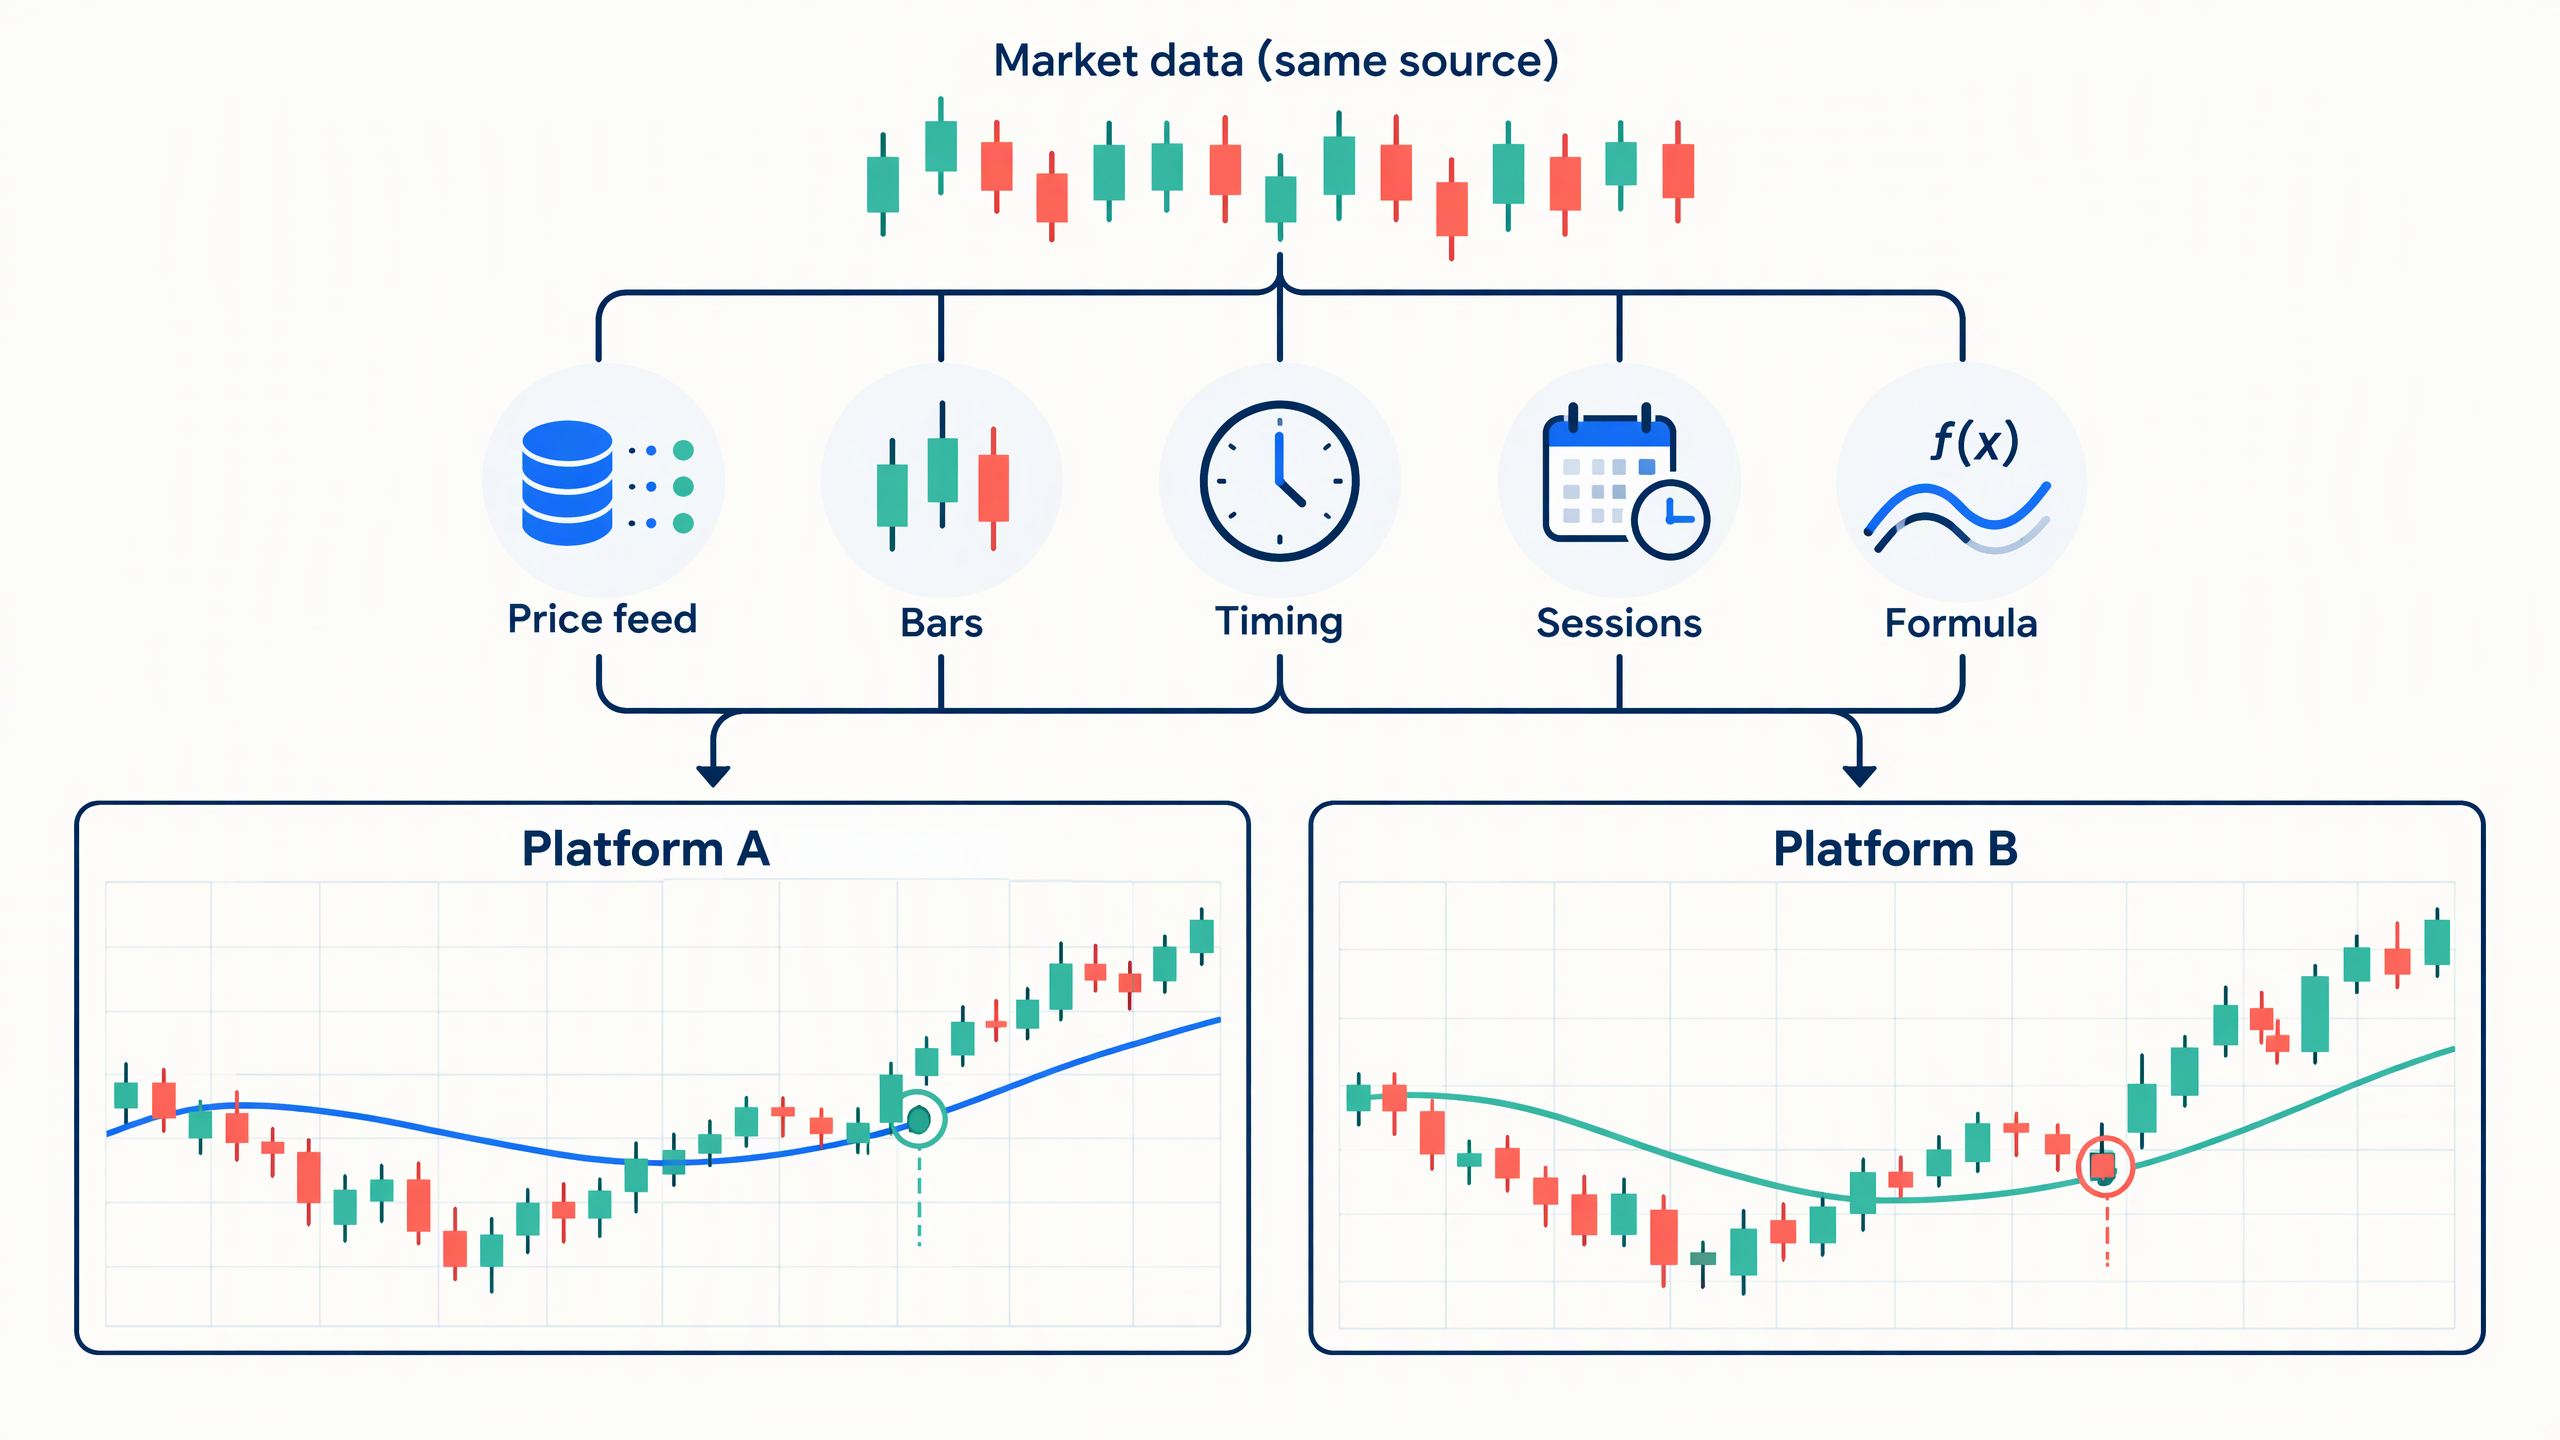
You copy an indicator to another charting platform, set the same symbol and period, and expect the same line or signal. Instead, the values drift—or a crossover appears one bar earlier. This is a common problem in trading indicator conversion. The code may look equivalent while the platforms are feeding it different data, building different bars, or evaluating it at different moments.
An indicator is not just a formula. Its output depends on the input price series, the sequence of bars, the timing of each calculation, and the platform’s implementation of the formula. To diagnose a mismatch, compare those ingredients before assuming the conversion is wrong.
1. The platforms may not be using identical price data
Two charts can show the same ticker while drawing on different data feeds, symbol mappings, or price types. One may use last-trade prices while another uses bid, ask, or a midpoint. A small difference in the source data can alter an OHLC value, volume reading, or the bar’s close. Indicators built from those values will inherit the difference.
Historical prices can also be adjusted differently. For example, a chart that adjusts past prices for dividends will not present the same historical price series as an unadjusted chart. TradingView documents dividend adjustment as a setting that changes how historical data is represented. 1
When comparing platforms, confirm the exact instrument and exchange, data provider, price type, and corporate-action adjustments. If the inputs do not match, identical code cannot guarantee identical output.
2. “A 5-minute bar” may not mean the same five minutes
Platforms must decide where each bar starts and ends. A five-minute candle aligned to the top of the hour can differ from one aligned to the start of the regular trading session. That difference changes the candle’s open, high, low, close, and volume—even if both charts are set to five minutes.
Chart settings can also change the construction. Extended-hours data may be included on one platform and excluded on another. A 24-hour candle is not necessarily equivalent to a daily session candle. For example, thinkorswim documents that the start time for time-based bars can depend on the price type and data source, and that an option can align certain aggregations to market open. 2
Non-time-based charts introduce another mismatch. Range, tick, Renko, and other synthetic or event-driven bars do not represent the same input sequence as ordinary time bars. A script converted from one chart type to another may need an explicit decision about which bar behavior to preserve.
3. Session settings change the bars included in the calculation
A session defines which trading times count for a symbol. Regular-hours-only and extended-hours charts can therefore feed different numbers of bars—and different prices—into the same lookback window. This matters especially for moving averages, VWAP, opening-range calculations, and indicators that reset at a session boundary.
Session rules may also depend on the exchange’s time zone, the selected subsession, and how the platform aligns a bar that overlaps a session boundary. TradingView’s documentation notes that exchanges define sessions for symbols and that session calculations use the exchange time zone by default unless another zone is specified. 3
Check the session template, time zone, trading days, overnight handling, and reset point. “Regular session” can be an important setting, not a cosmetic chart preference.
4. Live calculations can differ from closed-bar calculations
On an open candle, the high, low, and close can keep changing. An indicator that recalculates on each incoming update may move during the bar, while another platform or script may wait until the bar closes. The first platform can show a temporary threshold break or crossover that disappears before the candle is confirmed.
TradingView describes scripts executing across historical bars and realtime updates. Its repainting documentation explains that historical bars generally preserve final OHLC values, while realtime high, low, and close values remain fluid until the bar closes. 4 5
This difference is about when a value is calculated, not necessarily whether the formula was translated correctly. During validation, compare closed bars with closed bars, and compare live behavior separately. Also check whether alerts trigger intrabar or only after confirmation, and how higher-timeframe values are made available to lower-timeframe charts.
5. Historical depth and initialization affect recursive indicators
Many indicators depend on earlier values. Exponential moving averages, Wilder averages, and other recursive calculations carry information forward from an initial value. If one platform loads more history—or starts calculating from a different first bar—the early values can differ and the difference may persist, especially near the beginning of the chart.
Initialization rules can matter even when two implementations use the same smoothing formula. thinkorswim’s documentation describes Wilder’s average as starting with a simple moving average before applying recursive smoothing, and explicitly notes that its result can differ from a comparable exponential average because of initialization. 6
Historical datasets can also be revised or provide different starting points. TradingView lists data-feed revisions and variations in the beginning of a chart’s available history among causes of changing historical results. 5 When a converted indicator diverges gradually or only on older bars, compare the amount of loaded history and the seed or warm-up method before changing the main formula.
6. The indicator names may match while the implementations do not
A label such as “RSI,” “EMA,” or “VWAP” is not a complete specification. The calculation may use close, hl2, typical price, or another source. It may handle missing values differently, use a different smoothing or initialization rule, round at a different stage, or apply different defaults. Even a one-bar offset or a different rule for confirming a signal can change the plotted result.
During conversion, document the actual behavior of the source script rather than relying on its display name. Record the input series, period, smoothing type, reset conditions, treatment of missing bars, historical warm-up, and whether signals are provisional or confirmed. Then implement and test those choices in the destination platform.
A practical checklist for cross-platform indicator conversion
Before adjusting the converted code, compare both charts using the same symbol and date range. Then verify:
- The exchange or instrument mapping and price feed match as closely as possible.
- Dividend or split adjustments and the selected price type are the same.
- Timeframe, bar alignment, chart type, and extended-hours settings match.
- Session hours, time zone, trading days, and reset rules match.
- The indicator uses the same source series, parameters, smoothing, and initialization.
- You compare confirmed bars separately from values on an open realtime bar.
- Enough historical bars are loaded to warm up recursive calculations.
A useful debugging method is to compare intermediate values one step at a time. First compare the candle OHLCV data. Next compare the raw input series. Then compare the indicator’s first calculation and subsequent updates. This narrows the cause instead of treating every visible mismatch as a formula problem.
When should you use a conversion service?
If you already have a working indicator and need it on another platform, a careful conversion should preserve both the formula and its operating rules: data source assumptions, session behavior, timing, initialization, and alert conditions. Where the destination platform cannot reproduce a source behavior exactly, the conversion should make that limitation clear and choose an equivalent behavior that fits your use case.
For help translating an existing script and validating the result, see Cross-Platform Trading Script Conversion Services. Provide the source code or platform, the destination platform, a sample symbol and timeframe, and examples of where the outputs diverge. That makes it easier to separate a coding issue from a difference in chart data or settings.
Frequently asked questions
Can two platforms show exactly the same indicator values?
They can match closely when they use the same underlying data, bar boundaries, sessions, historical warm-up, and calculation rules. If any of those differ, exact matching may not be possible without changing the data or settings.
Does a different signal always mean the conversion is incorrect?
No. First compare the candles and settings. A different feed, session, or live-bar update rule can change the signal even when the translated formula is sound.
What should I send when requesting an indicator conversion?
Share the original script or its complete calculation rules, source and destination platforms, instrument, timeframe, session and extended-hours settings, and a few timestamps where the two outputs disagree. Screenshots help, but the underlying values or exported bar data are more useful for diagnosing small differences.