Most traders already have a strategy. It lives in their heads, in a trading journal, or in a set of screenshots with arrows drawn on them. The problem is not the idea—it is the execution bottleneck. A discretionary setup that requires checking the daily trend, waiting for a pullback, then confirming momentum across multiple charts is impossible to apply consistently to hundreds of symbols in real time. This is exactly where custom trading scanner development turns a mental model into an automated opportunity-detection engine.
The core idea is simple: every discretionary condition you use can be expressed as a programmable filter, and those filters can be layered, ranked, and monitored automatically. The article below walks through that translation process and shows a concrete example of a trend-pullback-momentum scanner.
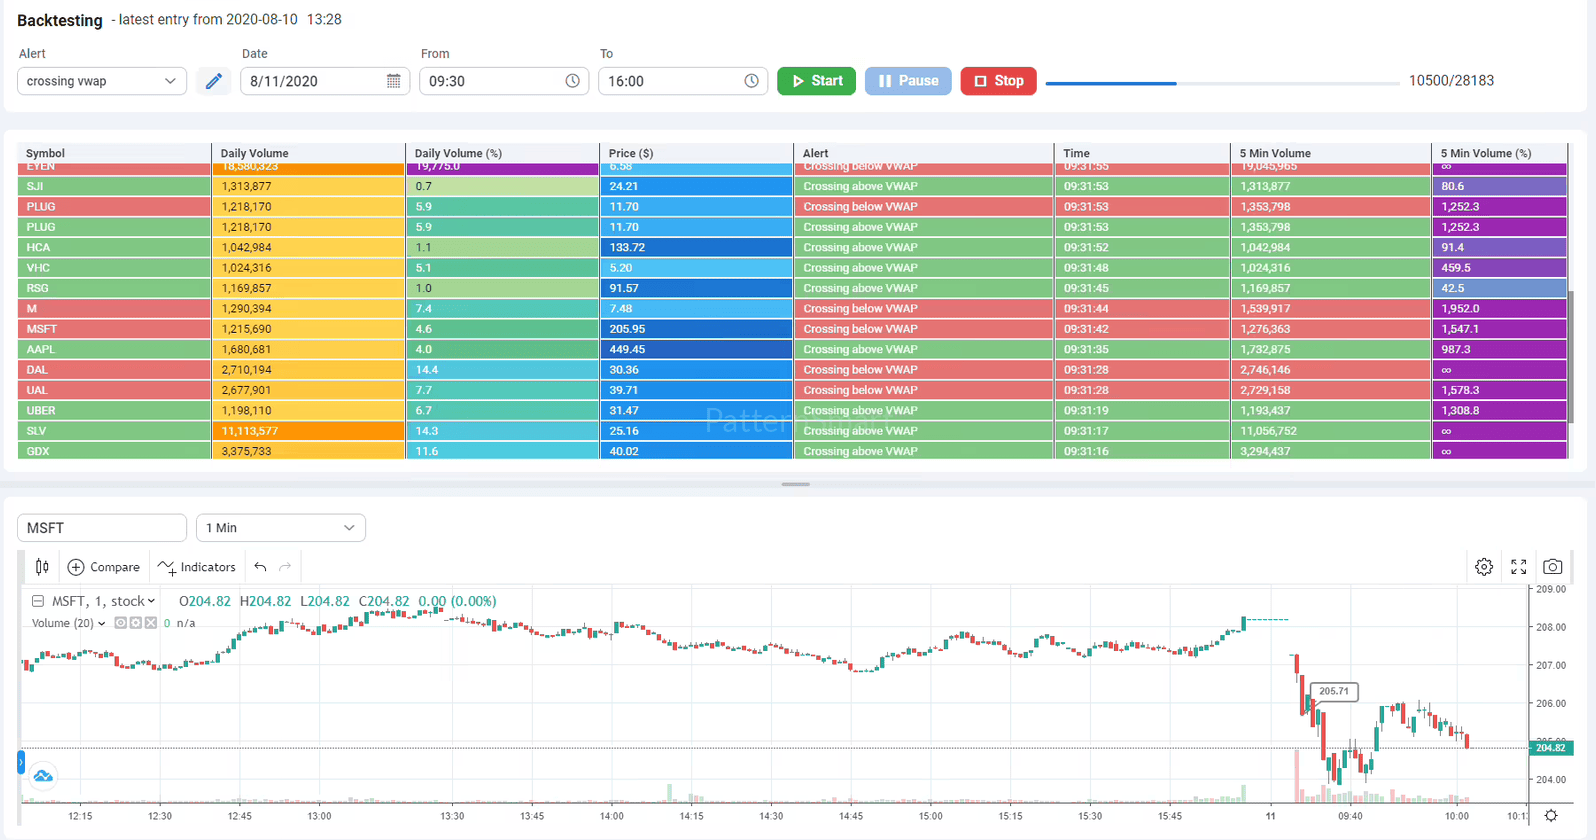
From “I know it when I see it” to “The scanner knows it when it happens”
Discretionary traders often describe setups in vague terms: “I want a strong stock that is pulling back but still holding the trend, and I want to see buyers stepping back in.” That sentence contains at least four separate programmable components:
- Universe definition — which symbols are even eligible.
- Trend direction — what “strong” and “holding the trend” mean numerically.
- Pullback condition — what qualifies as a valid pause rather than a reversal.
- Momentum confirmation — what proves that the pause is ending and the trend is resuming.
The illustration below shows the translation path. Each box is a filter that can be coded independently, then combined with Boolean logic (AND / OR / AT LEAST) inside a scanner engine.
Figure 1 — From discretionary language to scanner logic
Discretionary thought
        │
        ▼
┌───────────────────┐
│ “Strong stock”    │  → Universe filter: price > $5, ADV > 1M,
└───────────────────┘     relative strength vs SPY positive
        │
        ▼
┌───────────────────┐
│ “Trend is up”     │  → Daily EMA stack (e.g. 20 > 50 > 200),
└───────────────────┘     all rising, price above long EMA
        │
        ▼
┌───────────────────┐
│ “It pulled back”  │  → Price touches or nears fast EMA,
└───────────────────┘     pullback depth within ATR band
        │
        ▼
┌───────────────────┐
│ “Momentum is back”│  → RSI turns up, MACD histogram curls,
└───────────────────┘     volume expands on the trigger bar
Once each line is a rule, the scanner can check every symbol in the universe on every bar and return only the rows where all layers agree.
The three pillars of a practical scanner: trend, pullback, momentum
A scanner that only checks one condition will either fire too rarely or flood you with noise. The most useful custom scanners combine three independent layers that must align. This is the same logic behind multi-timeframe dashboards that display trend, momentum, and volatility side by side so the trader can see confluence at a glance.
Pillar 1 — Trend direction (the “permission” layer)
Trend is the highest-level filter. In a long-only scanner it answers one question: is this symbol structurally capable of producing a continuation setup? A common programmable definition is an EMA stack: for example, the 20 EMA above the 50 EMA, the 50 above the 200, and all three rising, with price above the 200. The breakout-scanner example in the search results gives trend alignment 30 out of 100 points, based on “EMA stack order, all rising, price above EMAs”.
This layer should always be evaluated on a higher timeframe than the trigger. If the trader’s holding period is measured in days, the trend filter might run on the daily chart while the pullback and momentum checks run on the 15-minute or hourly chart. The Augury Grid ranking system, for instance, scans multiple timeframes and gives a bonus when a row agrees with the same instrument on another timeframe.
Pillar 2 — Pullback condition (the “patience” layer)
The pullback is where most discretionary traders make subjective decisions. To make it programmable, you must define three things:
- Reference level: which moving average, VWAP, or prior structure the price is pulling back into.
- Depth tolerance: how far the pullback can go before the setup is invalidated. A useful normalization is ATR multiples rather than fixed percentages, because a 2% pullback means different things on a low-volatility utility stock and a high-beta futures contract.
- Quality of the pause: whether volume contracts during the pullback, whether the bar closes in the lower part of its range, or whether the pullback stays above a key swing low.
In the pullback-strategy examples from the search, the logic often searches for “pullbacks into a fast weighted moving average on a higher timeframe” while confirming that the broader trend remains intact. A programmable version might be: price low ≤ fast EMA × (1 + tolerance), and price low ≥ fast EMA × (1 − ATR_band), and daily trend is still bullish.
Pillar 3 — Momentum confirmation (the “trigger” layer)
Momentum confirmation is what separates a scanner from a simple watchlist. It answers: is the pullback actually ending? Programmable momentum checks include:
- RSI behavior: RSI was above 50 before the pullback, dipped toward 40–50, and is now turning up.
- MACD structure: the MACD histogram is contracting on the pullback and beginning to expand again in the trend direction.
- Volume signature: relative volume expands on the trigger bar compared with the average pullback bar.
- Price action trigger: a close back above the fast EMA or above the high of the prior bar.
The ConfluenceLab scanner, for example, scores momentum using RSI position, RSI slope, MACD histogram direction, and signal-line cross, and combines that with trend and key-level components into a single score. That scoring approach is useful because it turns multiple soft conditions into a rankable number rather than a binary yes/no.
Multi-timeframe requirements: the alignment matrix
A scanner that checks trend, pullback, and momentum on the same timeframe will produce many false positives. The trend may be up on the 5-minute chart while the daily chart is in a downtrend. The solution is to define an alignment matrix with a specific role for each timeframe.
Figure 2 — Example multi-timeframe alignment matrix for a long scanner
Layer Timeframe Condition Role Trend Daily EMA 20 > 50 > 200; all rising; close > EMA 200 Permission Setup context 1-hour Price above EMA 50; higher low structure intact Regime Pullback 15-minute Low touches EMA 20; pullback depth ≤ 0.5 × ATR(14); volume contracts Patience Trigger 5-minute Close > EMA 20; RSI(14) crosses above 50; relative volume > 1.2 Timing
The exact timeframes depend on the trading horizon, but the principle is universal: higher timeframe defines the direction, lower timeframe defines the entry. This is the same layered approach described in multi-timeframe scanner guides, where rules are built in layers—liquidity gate, primary anomaly, directional confirmation, then the next timeframe up.
A critical implementation detail is bar-close evaluation. A scanner that checks intrabar conditions will repaint and fire alerts that disappear. The engine should evaluate completed bars for the higher-timeframe conditions, and only the trigger layer may use the current forming bar if the strategy requires it.
Ranking criteria: when 40 symbols pass the filters
Filters produce a pass/fail list. Ranking produces a priority list. A scanner without ranking is still useful, but a scanner with ranking tells the trader where to look first. Ranking criteria should be derived from the same logic as the strategy, not from arbitrary popularity metrics.
Common ranking dimensions for a trend-pullback-momentum scanner include:
- Trend strength score: how cleanly the EMAs are stacked, how far price is from the long EMA, and whether the slope is accelerating.
- Relative strength: performance versus a benchmark (e.g. SPY for stocks, a front-month contract for futures). The breakout-scanner example awards a “sector bonus” for relative strength versus SPY.
- Pullback quality: tighter pullbacks with contracting volume score higher than wide, high-volume pullbacks.
- Momentum thrust: the magnitude of the trigger-bar expansion (RSI slope, MACD histogram change, volume ratio).
- Confluence bonus: extra points when the same signal appears on an additional timeframe. Augury Grid explicitly gives a bonus when a row agrees with another timeframe and marks it with a link icon.
In practice, ranking can be implemented as a weighted composite score. The breakout scanner uses a 0–100 scale with 40 points for pattern quality, 30 for trend alignment, 20 for momentum, and 10 for sector bonus. A custom scanner can use any weights, as long as the weights reflect the trader’s actual decision hierarchy.
Figure 3 — Scanner output with ranking columns
SYMBOL   TREND   PULLBACK   MOMENTUM   SCORE   ALERT
AAPL     PASS    PASS       PASS       87      READY
MSFT     PASS    PASS       PASS       82      READY
NVDA     PASS    PASS       WATCH      74      WATCH
AMD      PASS    WATCH      —          61      BUILDING
The “Alert” column in Figure 3 is not redundant. It distinguishes between all conditions met (READY), most conditions met but waiting on the trigger (WATCH), and early-stage setup (BUILDING). This staging is directly useful for alert design because it lets the trader receive different notification levels rather than a single binary ping.
Alerts: the scanner’s delivery mechanism
A scanner that only displays rows on a dashboard is a screening tool. A scanner that pushes notifications when conditions change is an alert system. The alert layer should support at least four notification paths:
- Sound and pop-up inside the platform or dashboard.
- Email for end-of-day or swing-trading workflows.
- Webhook for routing to Discord, Telegram, or an execution system.
- Chart annotation that draws the setup directly on the price chart.
PatternSmart’s development services explicitly list “multi-condition alert systems with sound, email, pop-up, webhook, or platform-supported notification options” as a core capability. The technical challenge is not the notification channel itself; it is deduplication. A condition that becomes true on one bar and remains true on the next five bars should fire once, not six times. The scanner needs state management: it must remember which symbol-setup combinations have already alerted, and reset only when the condition goes false and then true again.
A practical alert pipeline looks like this:
Figure 4 — Alert trigger sequence
Bar close
   │
   ▼
Evaluate trend filter (higher TF) ── fail ──▶ no alert, reset state
   │ pass
   ▼
Evaluate pullback filter ── fail ──▶ no alert, keep watching
   │ pass
   ▼
Evaluate momentum trigger ── fail ──▶ “WATCH” state, no push
   │ pass
   ▼
Check deduplication state ── already alerted ──▶ suppress
   │ not alerted
   ▼
Fire alert + write to log + update state
This is the difference between a scanner that is technically correct and one that is operationally usable. The alert layer is where most home-built scanners fail, because the developer focuses on the signal logic and treats notifications as an afterthought.
A practical example: trend + pullback + momentum agreement scanner
Consider a futures or stock scanner with the following rules. The goal is to find long continuation setups where the daily trend, the intraday pullback, and the momentum trigger all agree.
Universe filter
- Price > $10 (or futures equivalent minimum tick value).
- Average daily dollar volume > $20 million.
- Exclude symbols in a confirmed daily downtrend (close < 200 EMA and 50 EMA < 200 EMA).
Trend layer — daily chart
- EMA 20 > EMA 50 > EMA 200.
- All three EMAs rising over the last 5 bars.
- Close > EMA 200.
Pullback layer — 15-minute chart
- Price low has touched or come within 0.25 × ATR(14) of the 20 EMA.
- The pullback low is above the most recent swing low on the 15-minute chart.
- Volume on the pullback bars is below the 20-bar average volume.
Momentum trigger — 5-minute chart
- Close crosses above the 5-minute 20 EMA.
- RSI(14) on the 5-minute chart crosses above 50.
- Relative volume on the trigger bar > 1.2 × the 20-bar average.
Ranking
- Score = 40 × trend alignment + 30 × pullback quality + 30 × momentum thrust.
- Trend alignment is a 0–1 score based on EMA separation and slope.
- Pullback quality rewards tighter pullbacks with lower volume.
- Momentum thrust rewards larger RSI slope and volume expansion.
Alert
- Fire once per symbol per session when the momentum trigger becomes true and the higher-timeframe layers are already in a pass state.
- Suppress subsequent triggers until the 5-minute close falls back below the 20 EMA.
This is exactly the kind of logic that can be built inside a custom scanner development project. The same structure works for short scanners by inverting the trend and momentum conditions, and it works across asset classes because the filters are expressed in relative terms (ATR, EMA, relative volume) rather than fixed point values.
From a working prototype to a production tool
A trader can prototype this logic in a few hundred lines of Python using a data API and a simple loop. But a production scanner needs more than signal logic:
- Data handling: streaming vs polling, handling missing bars, corporate actions, and session boundaries.
- State management: tracking which symbols have already alerted and preventing duplicate notifications.
- Multi-timeframe synchronization: ensuring that the daily bar is complete before evaluating daily conditions.
- Universe maintenance: dynamically rebuilding the symbol list as liquidity and price change.
- Dashboard and logging: a UI that shows why a symbol passed or failed, not just that it passed.
- Platform integration: NinjaTrader, MetaTrader, TradingView, Thinkorswim, TradeStation, or a standalone web dashboard.
This is where custom trading scanner development becomes a specialized engineering task rather than a scripting exercise. The scanner must be reliable enough to run unattended, transparent enough to debug when a signal looks wrong, and flexible enough to adjust as the strategy evolves.
If the goal is to turn a discretionary strategy into a maintainable scanner—especially one with multi-timeframe logic, ranking, and alert routing—the most efficient path is often to work with a development team that specializes in trading software. PatternSmart, for example, provides custom trading software development services covering market screeners, scanners, alert systems, custom indicators, and platform-specific implementations. Their workflow starts with a requirement review of the trading rules and supporting materials, then produces a technical specification before coding begins, which is important for scanners because ambiguous rules become ambiguous alerts. You can explore their Custom Trading Software Development Services here:
https://patternsmart.com/wp/services/professional-custom-trading-software-development-services/
The bottom line
A custom market scanner is not a replacement for a trading strategy. It is a consistency engine. It takes the conditions a trader already uses—trend direction, pullback behavior, momentum confirmation—and applies them to every symbol on every bar without fatigue, bias, or skipped checks. The translation process is straightforward in principle: define the universe, codify each condition as a filter, require multi-timeframe alignment, rank the survivors, and route alerts with deduplication. The engineering effort lies in making that logic reliable, transparent, and maintainable in a live market. That is the difference between a spreadsheet with formulas and a scanner that a trader can actually trust.