If you are moving from TradeStation to MultiCharts, you probably do not want to rebuild years of work from scratch. The good news is that you usually do not have to. When you convert EasyLanguage to PowerLanguage, most classic indicators transfer with little or no change.
The risk is assuming that all of them do.
A study can import cleanly, compile on the first attempt, and still plot differently, trigger alerts at a different time, or behave differently on historical and live bars. That is why a proper MultiCharts indicator conversion is not just a copy-and-paste job. It is a three-part process: check compatibility, adapt the code where PowerLanguage differs, and then test the converted behavior against the original.
This guide explains what transfers, what does not, and how to verify the result.
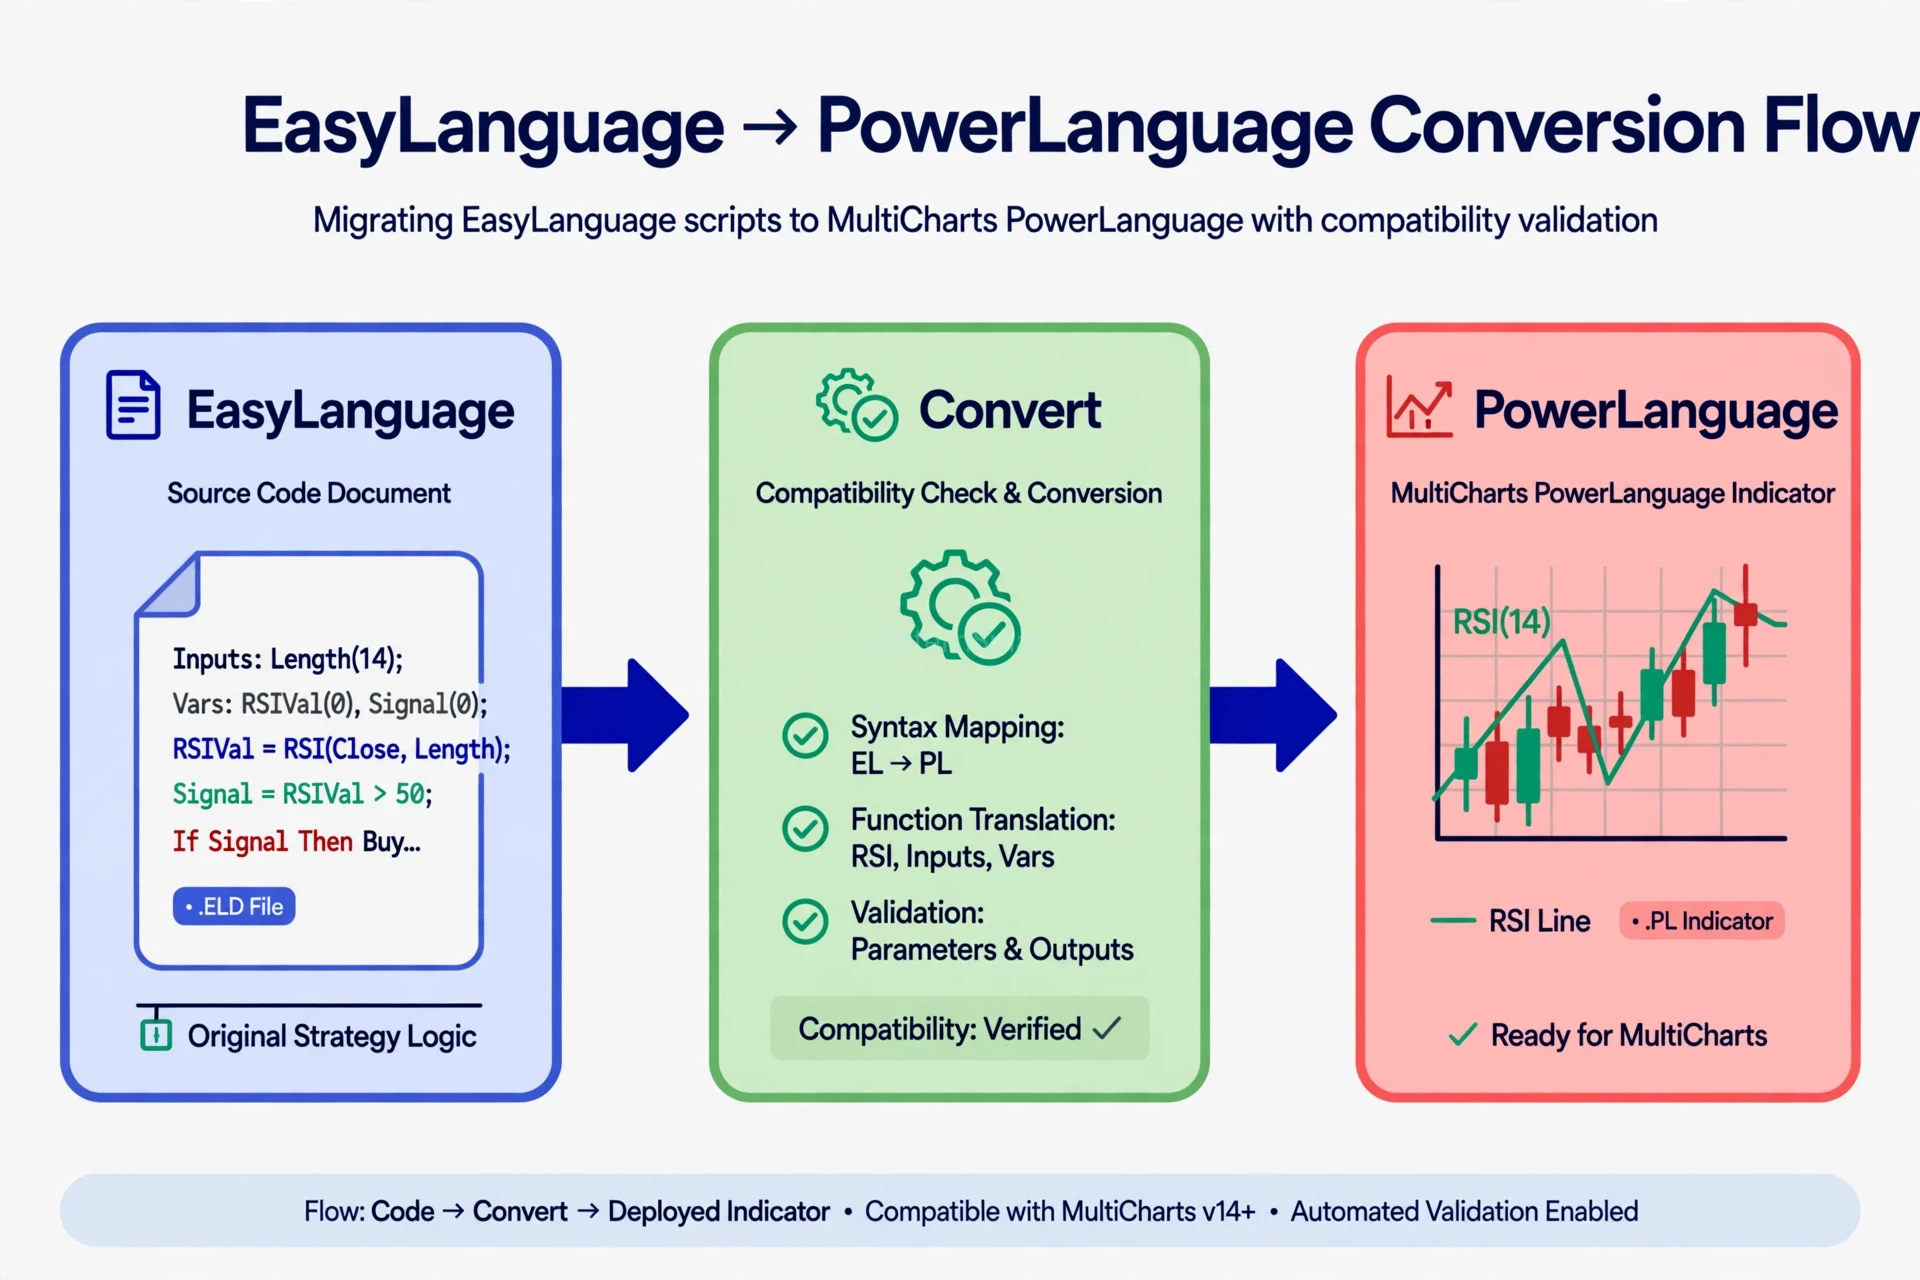
Figure 1: A reliable conversion follows the same path every time — review the original logic, check compatibility, adapt the code, and validate the output before you rely on it.
Why Traders Convert EasyLanguage to PowerLanguage
Traders usually convert for one of four reasons:
- Changing platforms without losing a proven library of indicators and strategies
- Using a different broker or data feed while keeping the same analysis in MultiCharts
- Consolidating tools built over years in TradeStation into one MultiCharts workspace
- Extending an existing indicator — adding alerts, multi-timeframe logic, a dashboard, or strategy rules — in its new home
In all four cases, the value is in the original logic. The goal of conversion is to preserve that logic exactly, not to reinterpret it. Any change in calculation order, warm-up period, data reference, or bar-by-bar behavior can change what the indicator is actually telling you.
How Compatible Are EasyLanguage and PowerLanguage, Really?
MultiCharts describes PowerLanguage as an evolution of EasyLanguage, and documents broad EasyLanguage compatibility. MultiCharts has tested thousands of EasyLanguage indicators and strategies, and classic, procedural EasyLanguage studies are the strongest case: many compile in the PowerLanguage Editor with no changes at all.
That broad compatibility is real — but it is not total compatibility. MultiCharts also identifies differences in supported programming features, and those differences are exactly where conversions fail.
Think of compatibility in three tiers:
Usually transfers cleanly – Inputs, variables, and arrays declared in the classic style – Core calculations using standard built-in functions — moving averages, RSI, MACD, stochastics, Bollinger Bands, and similar studies – If / Then / Else logic and Begin / End blocks – Plots, plot styling, and standard alert conditions – Multi-data references such as Data2, when the chart is set up the same way
Needs a review and often a small adaptation – Reserved words and order phrasing that differ between the two languages – Drawing objects — trendlines, text, and arrows — and their related functions – TradeStation-oriented functions that have a PowerLanguage equivalent with a different name or behavior – Code that depends on intrabar behavior, bar status, or a specific session template
Does not transfer directly – Object-oriented EasyLanguage, introduced in later TradeStation versions — classes, methods, and OO structures are not supported in PowerLanguage – Protected or locked EasyLanguage files — a protected file cannot be imported and converted unless you have the unlocked source
If your library is mostly classic indicators, your MultiCharts indicator conversion will likely be straightforward. If it includes object-oriented code, drawing-heavy studies, or protected files, plan for a rewrite of those parts rather than a simple import.
Figure 2: Most classic code is compatible. Object-oriented EasyLanguage, protected files, and differing reserved words are the three areas to check first.
Reserved-Word and Syntax Differences to Watch
Reserved-word differences are the most common cause of a failed first compile — and, fortunately, the easiest to fix once you know where to look.
Examples that regularly catch traders out include:
- Word order in strategy orders. Phrasing that TradeStation accepts may need to follow the order given in the PowerLanguage Keyword Reference. An order line can use familiar words and still fail to compile if the quantity, contract, and timing elements are arranged differently.
- Legacy next-bar references. Older code that references the next bar with legacy wording may need the current PowerLanguage equivalent.
- Unsupported or renamed keywords. Some EasyLanguage reserved words are not supported in PowerLanguage, some are supported with different behavior, and PowerLanguage also has functions of its own that have no direct EasyLanguage original. There is no substitute for checking each flagged word against the PowerLanguage Keyword Reference rather than guessing.
- Strict block structure. Every
Beginneeds its matchingEnd,Beginitself is not followed by a semicolon, and statement punctuation matters. Small syntax slips that were tolerated in the workflow you came from can stop a PowerLanguage compile.
For indicators — as opposed to strategies — the order-syntax issues do not apply, but reserved words still do. A single unsupported function inside an otherwise simple calculation is enough to block the whole study.
The practical rule: when you convert EasyLanguage to PowerLanguage, treat every compile error as information, not as a verdict. Most point to a specific, fixable difference rather than a fundamental incompatibility.
Programming Structure: How a PowerLanguage Indicator Is Built
Good MultiCharts PowerLanguage programming keeps the same clear structure as good EasyLanguage — which is another reason classic code ports well. A typical indicator is built in this order:
- Inputs — the values the user can change in the study settings, such as length, price source, thresholds, colors, and alert switches. Inputs cannot be changed by the code itself.
- Variables — the values the code calculates and updates bar by bar, including any intrabar variables the logic needs.
- Calculation logic — conditions, loops, and function calls, organized in
Begin / Endblocks where a statement needs more than one line. - Output —
Plotstatements for values and styling, plus alert logic where the study supports it.
Just as important is keeping the three study types separate:
- A function holds reusable calculation logic.
- An indicator calculates and displays information; it does not place trades.
- A signal contains trading instructions and is what gets backtested and, if you choose, automated.
When a converted indicator does not behave as expected, this structure is where to check first. Was a helper function converted as well, or only the indicator that calls it? Are the inputs set to the same defaults as the original? Is a value stored in a variable that resets when it should persist across bars? Structure problems produce behavior problems that look, at first glance, like calculation problems.
All of this work happens in the PowerLanguage Editor, where studies are created, imported, edited, and compiled. Remember that PowerLanguage code is compiled: it must pass that compile step before it can be applied to a chart at all.
A Step-by-Step MultiCharts Indicator Conversion Process
- Inventory the original code. List every indicator, function, and signal in the set, and note the dependencies between them. Convert functions first, because indicators and signals call them.
- Check the source is usable. Confirm you have the unprotected source code and the right to use it. Protected files need the unlocked original.
- Import and compile. Bring the code into the PowerLanguage Editor — unprotected EasyLanguage files can be imported, and source can also be pasted in — then compile and log every error rather than fixing them one at a time and recompiling blindly.
- Adapt the differences. Resolve reserved words, renamed or unsupported functions, drawing-object code, and any object-oriented sections that need to be rewritten procedurally.
- Match the chart setup. Apply the converted study to the same symbol, interval, session, and data history as the original, with identical input values.
- Test the behavior — the step in the next section — before you use the indicator in live analysis or convert the rest of the library the same way.
Testing the Behavior of Converted Indicators
Compiling is not the same as converting correctly. A converted indicator is only finished when its output matches the original under the same conditions.
Test in this order:
1. Compare plot values, bar by bar Do not rely on a quick visual glance. Compare actual values at specific bars — ideally by exporting or printing values from both platforms for the same bars. Two lines can look identical on a compressed chart and still differ by enough to change a crossover or threshold signal.
2. Control the data Use the same symbol, the same interval, and as close to the same data history as possible. Different data feeds produce different bars, and different bars produce different indicator values — a data difference can masquerade as a conversion error.
3. Allow for the warm-up period Indicators that use averages and recursive calculations need history to stabilize. Set the same MaxBarsBack / maximum bars back requirement in both platforms and ignore the earliest bars in your comparison, where values are expected to be unsettled.
4. Check conditions, not just lines Test the moments that matter: crossovers, overbought and oversold thresholds, color changes, show-me dots, and alert triggers. Confirm each fires on the same bar, at the same value, in the converted version.
5. Test historical and intrabar behavior separately An indicator that updates on every tick can repaint or trigger differently from one evaluated at bar close. If the original relied on intrabar updates, verify that behavior specifically on live or replayed data — a historical chart alone will not reveal a mismatch.
6. For strategies, test fills as well as signals If your conversion includes a signal, matching entries on the chart is not enough. Compare backtest trades, fill assumptions, stops, and targets. Order phrasing and execution settings affect results independently of the indicator logic.
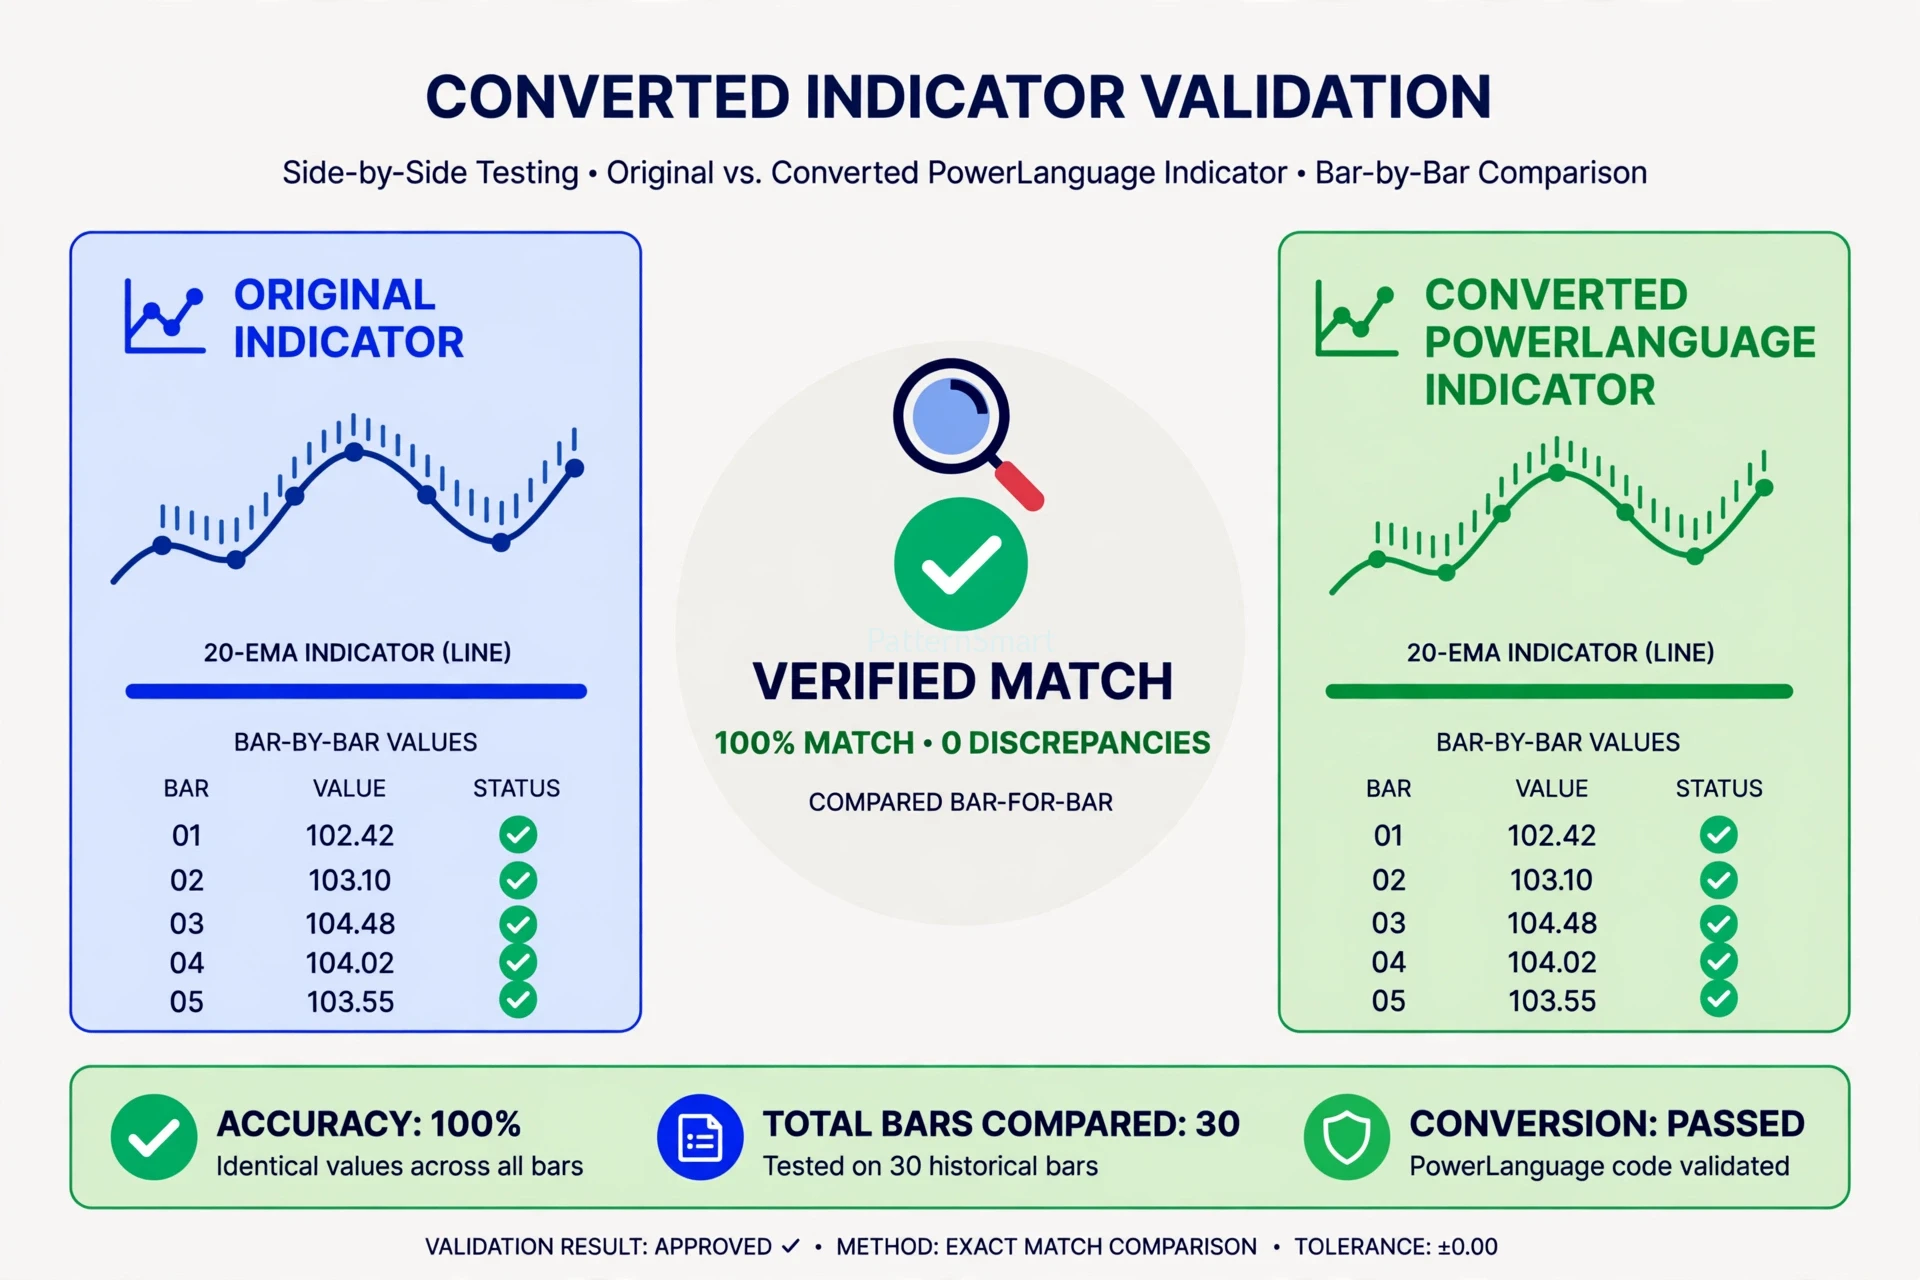
Figure 3: Side-by-side, bar-by-bar comparison is the reliable way to confirm a converted indicator behaves like the original.
Common Conversion Mistakes
- Declaring success at the first compile. Compilation proves the syntax is valid, not that the logic survived the move.
- Converting the indicator but not its functions. Missing or mismatched helper functions are a leading cause of wrong values.
- Comparing charts with different data or inputs. You end up debugging the chart setup instead of the code.
- Ignoring the warm-up bars. Early differences are often a history-length issue, not a bug.
- Assuming a visual match is a numeric match. Always spot-check numbers.
- Trying to force object-oriented code across. OO sections need a procedural rewrite — or, if the OO design is essential, a different development route altogether.
Should You Convert It Yourself or Get Help?
A single, classic indicator with clean source code is a reasonable do-it-yourself project: import it, fix any reserved-word errors, and test it against the original.
Help becomes worthwhile when:
- You are converting a whole library, not a single study
- The code uses object-oriented EasyLanguage, drawing objects, or multiple data streams
- The source is old, undocumented, or written by someone else
- The indicator feeds a live strategy, so a silent behavior difference has a real cost
- You want features added during the move — new alerts, inputs, or a dashboard
PatternSmart’s MultiCharts Custom Development Services cover exactly this work as part of its broader Custom Trading Software Development Services: reviewing the original EasyLanguage source, adapting it for MultiCharts PowerLanguage programming, and testing the converted indicator or strategy so it behaves as intended — with your trading logic handled confidentially.
Frequently Asked Questions
Is PowerLanguage the same as EasyLanguage? No, but they are close relatives. PowerLanguage was built for broad EasyLanguage compatibility, so most classic EasyLanguage studies work in MultiCharts with little or no change. It is not identical: some reserved words differ, some features are not supported, and object-oriented EasyLanguage is not supported.
Can I import an ELD file directly into MultiCharts? Unprotected EasyLanguage files can be imported into the PowerLanguage Editor. Protected or locked files cannot — you will need the unlocked source code before any conversion can begin.
My indicator compiles but plots different values. Why? The usual causes are a mismatched helper function, different input values, different data or chart history, a different warm-up requirement, or a function whose PowerLanguage behavior differs subtly from its EasyLanguage counterpart. Compare values bar by bar under identical chart settings to isolate which one it is.
Do strategies convert the same way as indicators? The process is similar, but strategies need extra testing. In addition to calculations and plots, you must verify order syntax, entries and exits, stops and targets, and backtest fill assumptions.
How long does a MultiCharts indicator conversion take? A simple, classic indicator can be converted and tested quickly. A study with custom functions, drawing objects, multiple data streams, or object-oriented sections takes longer, because those parts may need to be rewritten and then re-tested.
The Bottom Line
To convert EasyLanguage to PowerLanguage successfully, do not stop at getting the code into MultiCharts. Check compatibility first — especially object-oriented code, protected files, and reserved words. Keep the programming structure clean and convert the functions your indicator depends on. Then prove the conversion worked by comparing values, conditions, and alerts bar by bar on the same data.
Done that way, a MultiCharts indicator conversion preserves the work you have already done in TradeStation and gives you a study you can trust in its new platform — not just one that happens to compile.