If you have ever hit the limit of a built-in indicator, you already know the problem. Standard tools are built for everyone, which means they are perfect for no one. MultiCharts .NET indicator development solves that by letting you build exactly what your strategy needs — in C#, with the full power of .NET behind it.
For traders who need advanced, customized trading tools, this is where MultiCharts moves from a charting platform to a true development platform. You can create proprietary indicators, automate complex strategies, connect to external data, and control exactly how everything is calculated and plotted.
Primary keyword: MultiCharts .NET indicator development
Also covers: MultiCharts C# programming • PowerLanguage .NET development
For: Traders who need advanced customized tools
This guide explains the .NET programming environment, how a custom indicator is structured, how plotting works, and when MultiCharts C# programming is the right choice over classic PowerLanguage.
What Is MultiCharts .NET?
MultiCharts .NET is the .NET edition of MultiCharts. Instead of writing only in the traditional PowerLanguage scripting language, you write in C# or VB.NET using PowerLanguage .NET development.
MultiCharts’ official programming guide documents creating .NET indicators using C# and VB.NET. In practice, most professional traders and developers choose C# because of its performance, object-oriented structure, large developer community, and easy access to .NET libraries.
The result is familiar on the surface — you still apply studies to charts, run backtests, and optimize — but fundamentally different underneath. Your code compiles to a .NET assembly, runs on the .NET Framework, and can use everything from advanced math libraries to external APIs.
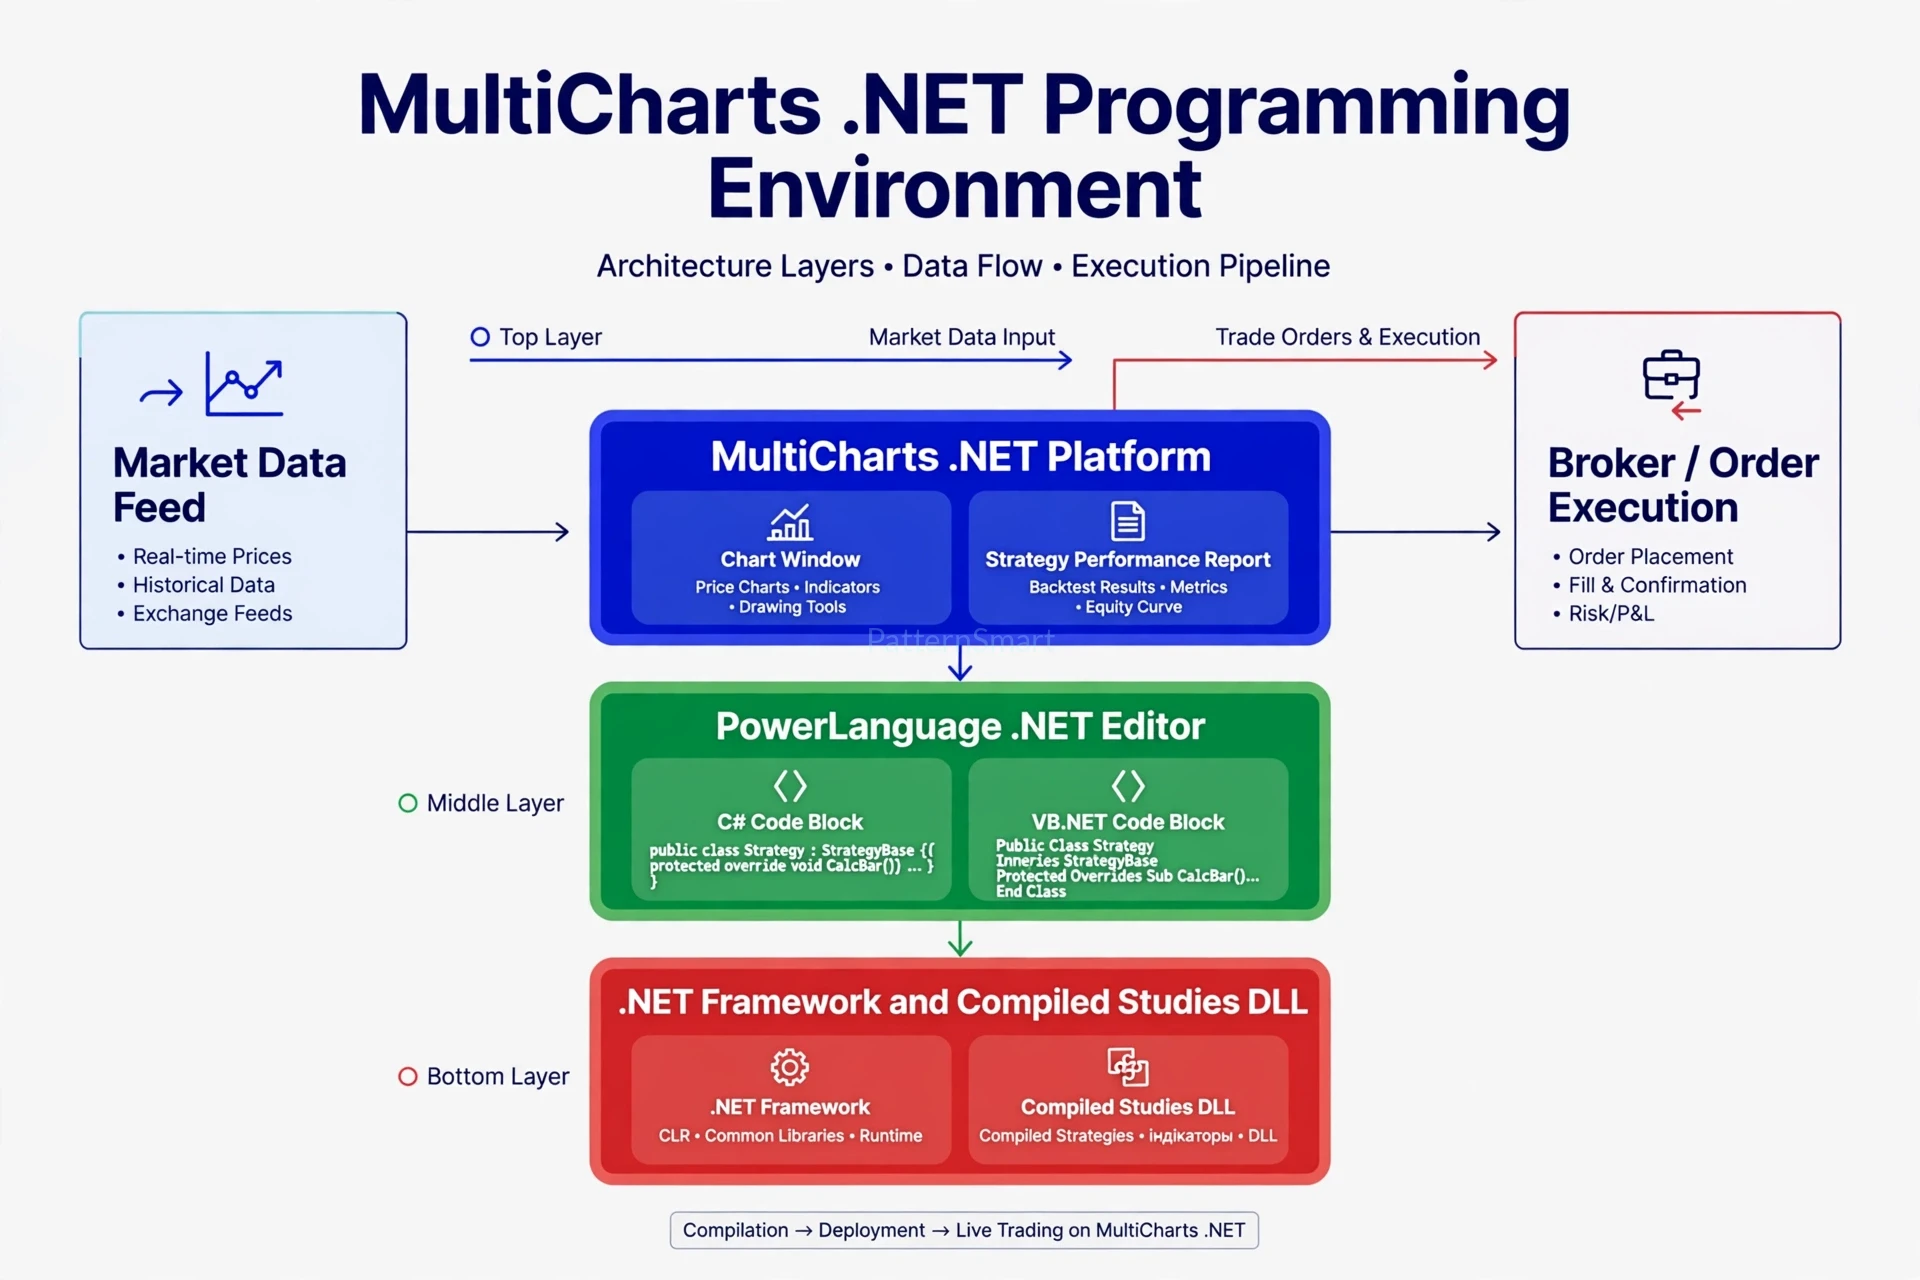
The .NET Programming Environment Explained
Understanding the environment is the first step to building reliably.
1. PowerLanguage .NET Editor
This is the built-in editor inside MultiCharts .NET. It is where you create a new indicator, signal, strategy, or function, write C# code, and compile it.
It provides syntax highlighting, error checking, and direct access to MultiCharts objects like Bars, Close, Open, High, Low, Volume, and order generation commands.
For larger projects, many developers also work in Visual Studio and then bring the logic into MultiCharts .NET. That workflow is especially useful for portfolio-level systems, shared libraries, and code that needs unit testing.
2. The .NET Framework and Compiled Studies
When you compile, your C# code becomes a DLL — a compiled study library. MultiCharts .NET loads that DLL and runs your indicator or strategy on every bar.
Performance
Compiled C# runs fast, even with heavy calculations over long histories or multiple symbols.
Reusability
Build base classes, helper functions, and libraries once, then reuse them across indicators and strategies.
Extensibility
Reference standard .NET libraries, third-party math libraries, and your own external DLLs.
Maintainability
Object-oriented code is easier to test, version, and extend than a long script.
3. Data Flow: Bars In, Decisions Out
Market Data Feed → Chart / Bars → Your C# Code (CalcBar) → Plots or Orders → Broker / Performance Report
On every new bar (or tick, depending on your settings), MultiCharts calls your calculation method. Your code reads price data, updates its internal state, plots a value, or generates an order. That loop is the heart of every custom study.
Custom Indicator Structure in C#
Every custom indicator in MultiCharts .NET follows the same core structure. Once you learn it, you can build almost anything.
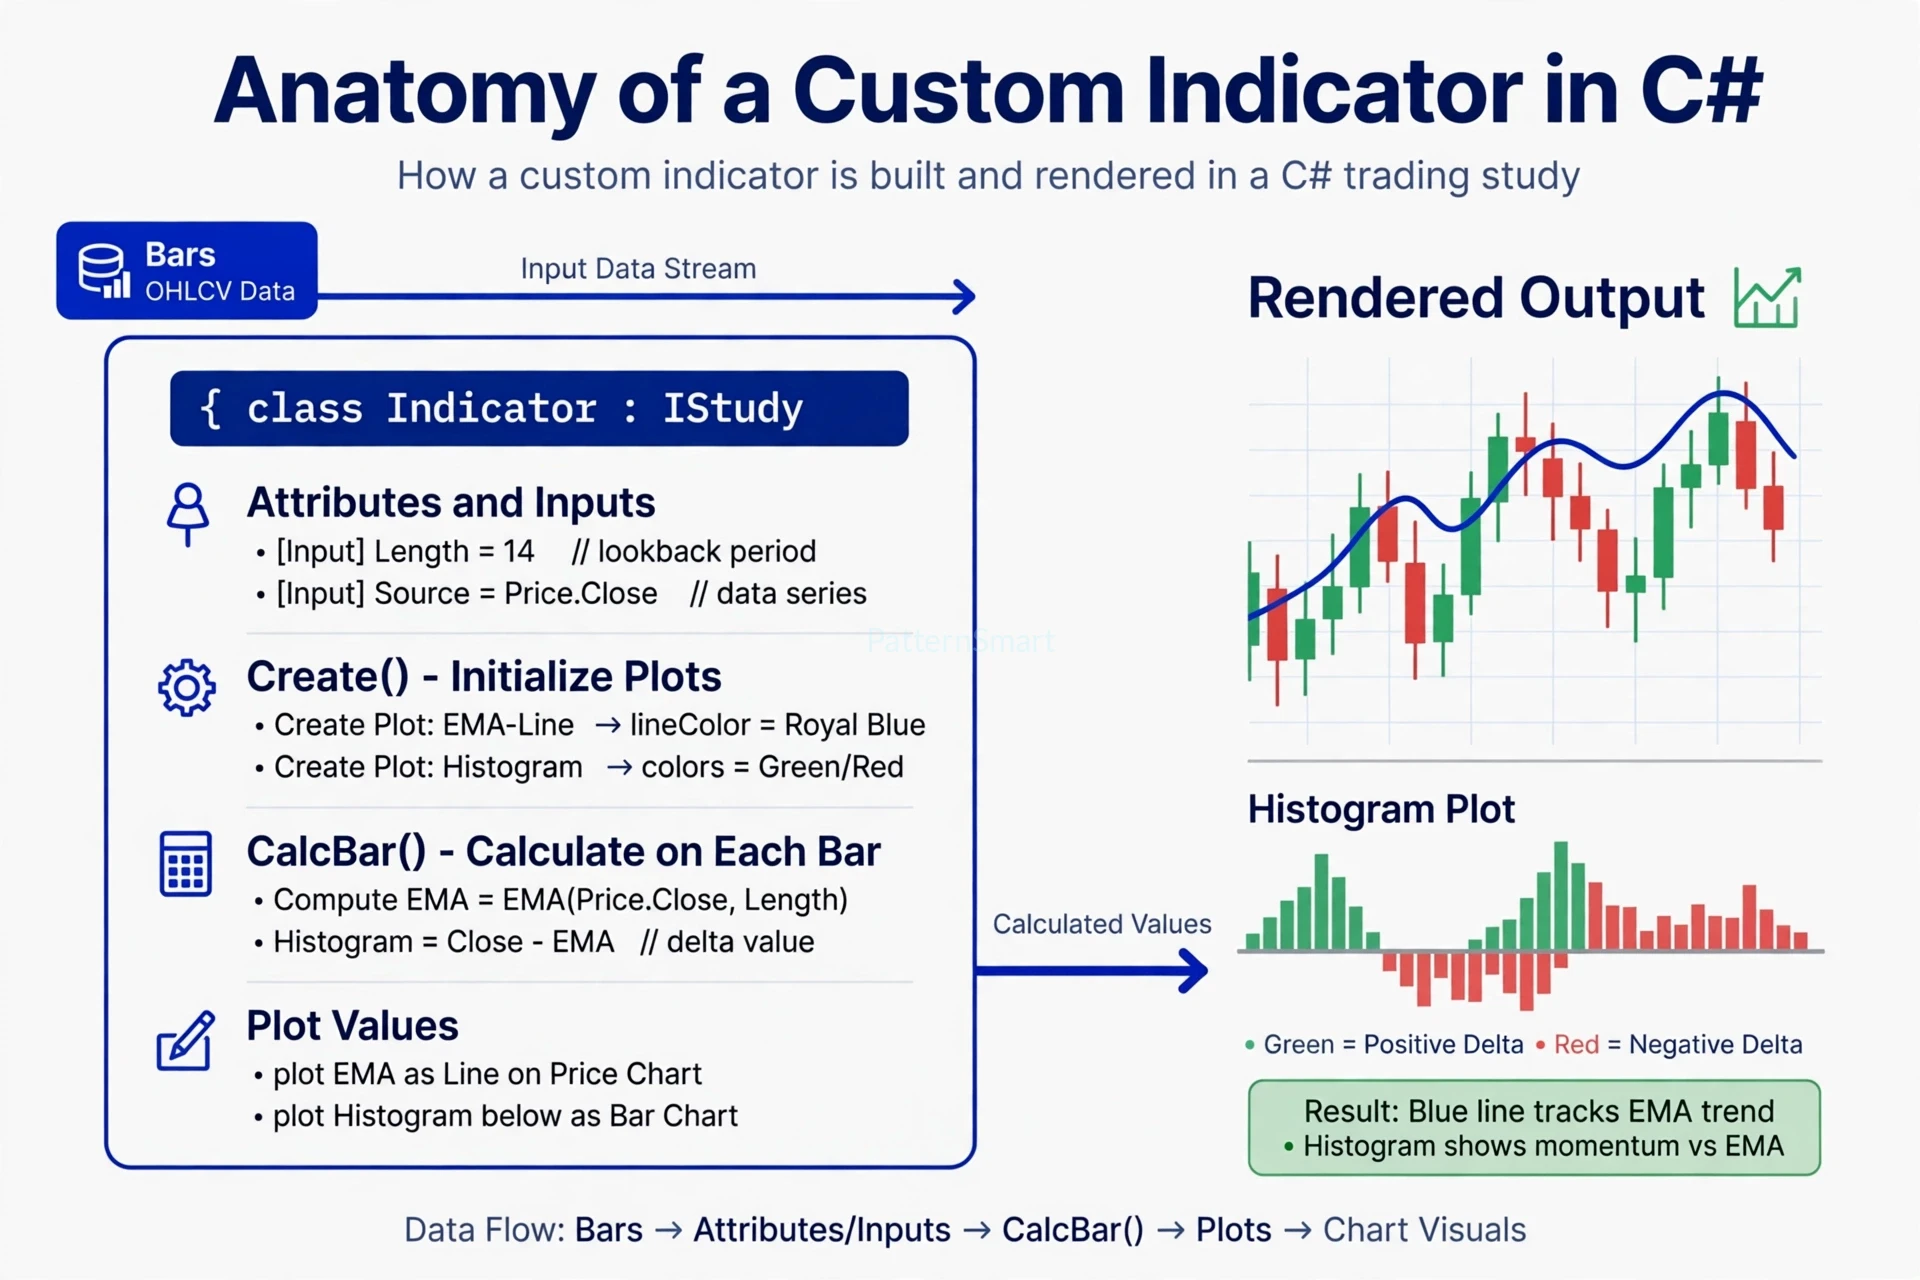
The Four Building Blocks
1. Attributes and Inputs — These define how your indicator appears in MultiCharts and what the user can change. Inputs are the parameters traders adjust without editing code — length, source price, multiplier, show/hide toggles, and so on.
[Input]
public int Length = 14;

[Input]
public EPriceSource Source = EPriceSource.Close;
2. Create() — Initialization — Create() runs once when the indicator is loaded. This is where you set up plots, create variable series to hold calculations, and initialize any objects you will reuse.
protected override void Create()
{
    // Create a line plot for the EMA
    AddPlot(new PlotAttributes("EMA", EPlotShapes.Line, Color.RoyalBlue));

    // Create a histogram plot for momentum
    AddPlot(new PlotAttributes("Histogram", EPlotShapes.Histogram, Color.Green));
}
3. CalcBar() — Calculation on Each Bar — CalcBar() is called for every bar on the chart. This is where your logic lives.
protected override void CalcBar()
{
    // Calculate EMA on close
    double emaValue = Bars.Close.EMA(Length)[0];
    double delta = Bars.Close[0] - emaValue;

    // Store and plot values
    Plot1.Set(0, emaValue);
    Plot2.Set(0, delta);
}
4. Plot Values — Plotting is not an afterthought. In MultiCharts .NET, a plot is a named output that you set in CalcBar(). You control its shape, color, width, and whether it draws on the price pane or in a separate sub-chart. Good indicator design means thinking about plots from the start: what should the trader see instantly, and what should stay hidden as an internal calculation?
Plotting: How Values Become Visuals
Plotting is what turns math into a usable trading tool. In PowerLanguage .NET development, you have precise control over it.
Key Plotting Concepts
- Plot Shapes: Line, histogram, point, bar, cross, and more. Use a line for trend, a histogram for momentum or volume delta, and points for signals or divergences.
- Pane Placement: Plot on the main price chart for overlays like moving averages, bands, and VWAP. Plot in a separate pane below for oscillators, momentum, or custom breadth measures.
- Dynamic Colors: Change color based on conditions — for example, green when momentum is rising, red when falling, or blue when a trend is neutral. This makes regime shifts visible at a glance.
- Multiple Plots: One indicator can output several plots at once. A single custom study might show an upper band, lower band, midline, and a signal histogram — all calculated together.
- Drawings and Text: Beyond plots, you can draw trendlines, rectangles, labels, and arrows directly from code to highlight breakouts, sessions, or trade zones.
Practical tip: Separate calculation from visualization. Calculate your core value once, store it in a variable series, then decide how to plot it. That keeps your code clean and makes it easy to change colors or shapes later without breaking the math.
Example: A Cleaner Custom Momentum Indicator
Instead of just copying RSI or MACD, many traders build a custom version that fits their market:
- Use a volatility-adjusted lookback instead of a fixed length
- Smooth the raw value to reduce whipsaws
- Add a zero-line cross signal and color the histogram by trend strength
- Plot a background highlight when the market is in a high-volatility regime
The indicator still looks simple on the chart. The complexity is hidden in the C# logic, not in the trader’s workflow.
Strategies in C#: From CalcBar to Order Generation
Indicators visualize. Strategies act.
A strategy in MultiCharts .NET uses the same Create() and CalcBar() structure, but instead of only plotting, it generates orders.
protected override void CalcBar()
{
    // Example: Trend + momentum filter
    bool trendUp = Bars.Close[0] > Bars.Close.EMA(50)[0];
    bool momentumUp = MomentumValue > 0;

    if (trendUp && momentumUp && MarketPosition == 0)
    {
        Buy("LongEntry", 1);
    }

    if (!trendUp && MarketPosition > 0)
    {
        Sell("LongExit", MarketPosition);
    }
}
With C#, you can go far beyond simple crossovers:
- Multi-timeframe logic: Confirm a daily trend while timing entries on a 5-minute chart.
- Multi-symbol logic: Trade a pair, spread, or rotation system that watches several symbols at once.
- Portfolio logic: Apply risk rules across all open positions, not just one chart.
- Custom order management: Scale in/out, use ATR-based stops, breakeven moves, time-based exits, or session filters.
- Advanced backtesting: Use the Strategy Performance Report to test the exact logic you will trade live, including commissions, slippage, and position sizing.
This is where MultiCharts C# programming really pays off. You are not forcing your idea into a scripting language. You are expressing it in a full programming language.
When Is C# Development Appropriate?
Not every idea needs C#. PowerLanguage is excellent for quick ideas, simple indicators, and fast prototyping.
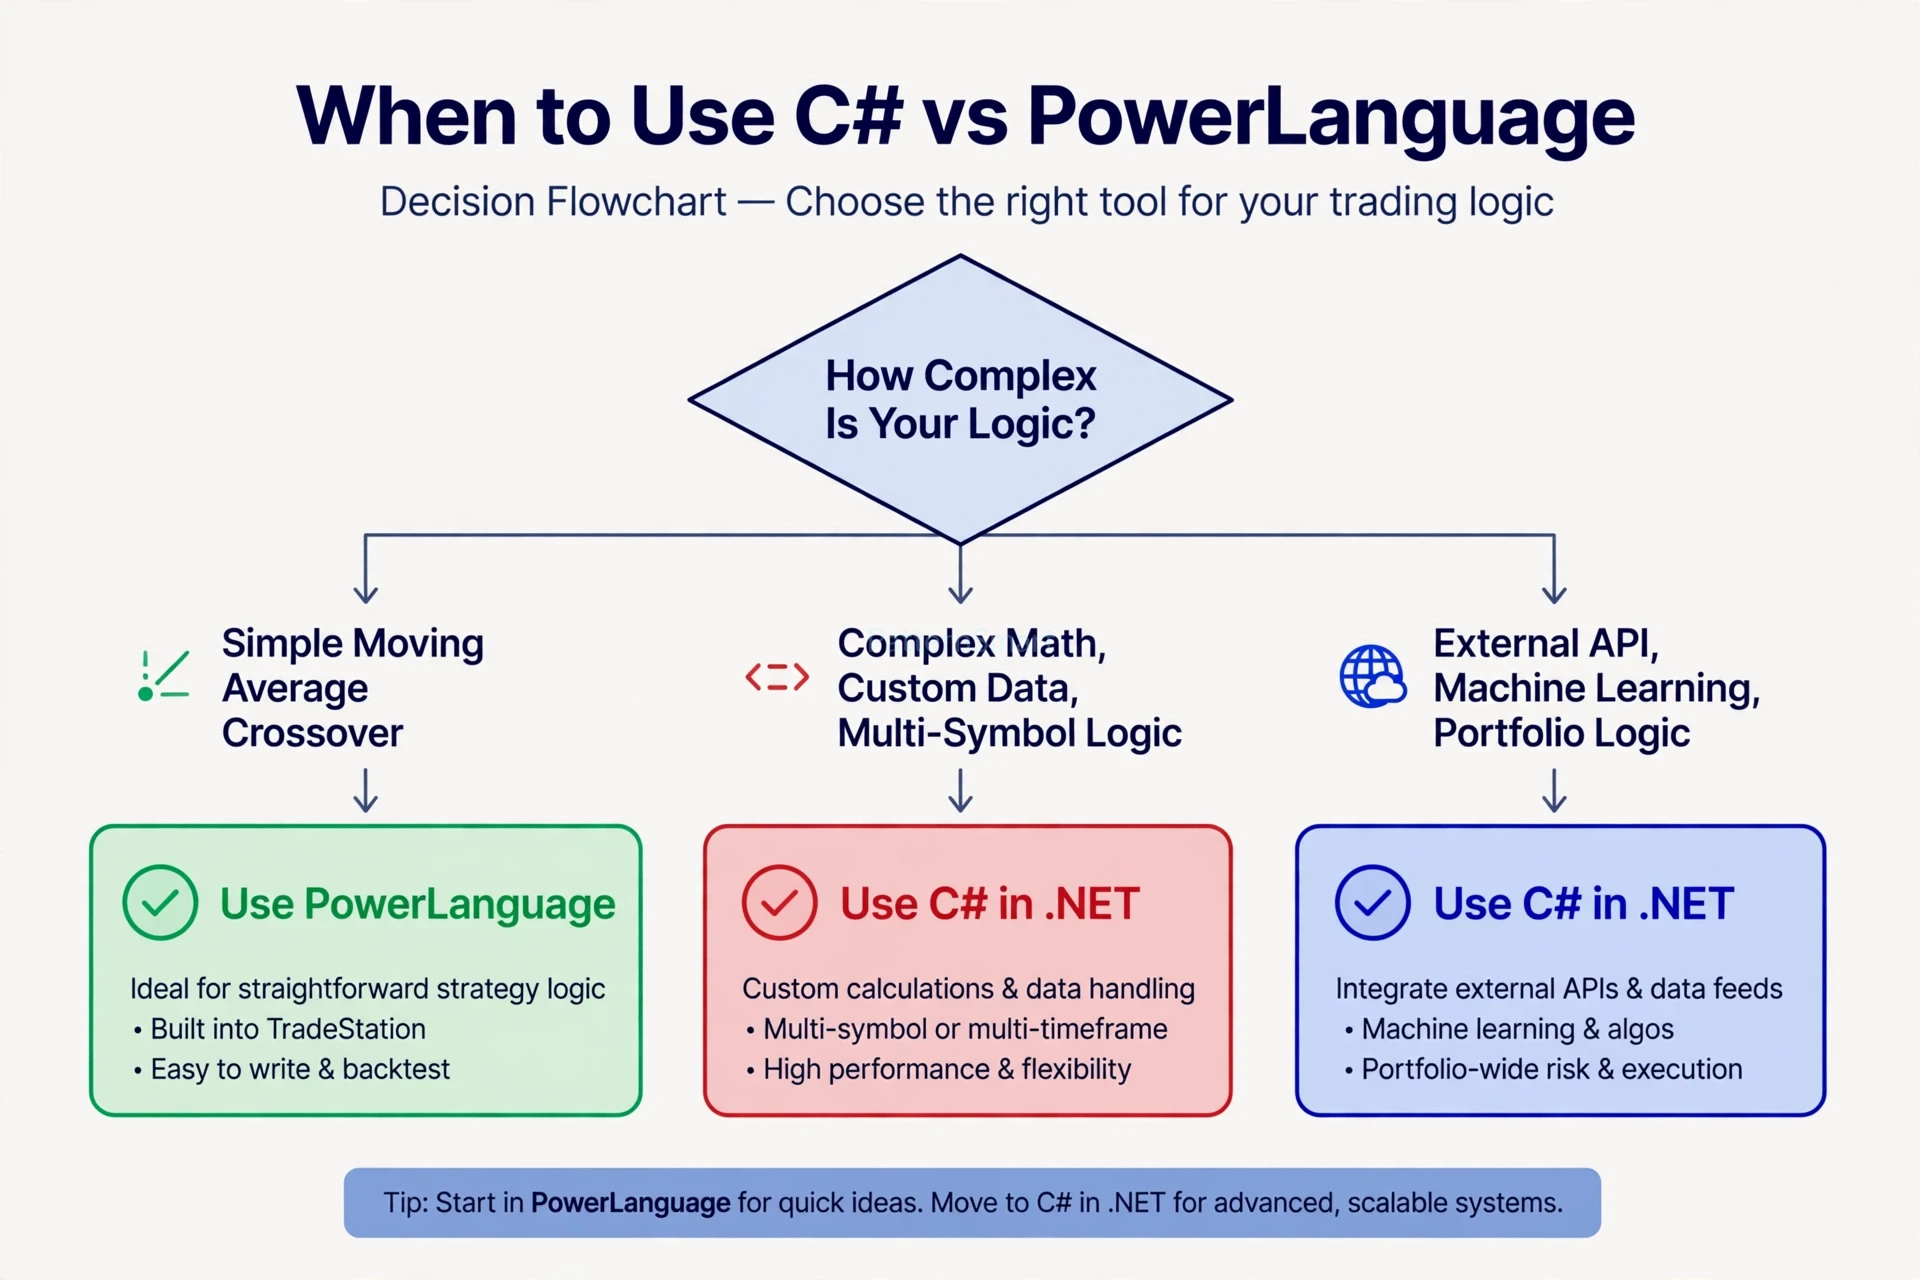
Stay with PowerLanguage When:
- You need a simple moving average, crossover, or basic oscillator
- You want to test an idea in 10 minutes
- The logic is one symbol, one timeframe, and a few conditions
- You do not need external data or libraries
Move to C# in MultiCharts .NET When:
- Math is complex: Custom volatility models, statistical filters, regression, Fourier analysis, or machine learning features
- You need structure: Object-oriented design, reusable classes, and clean separation of calculation, risk, and execution
- You need speed: Large datasets, tick-level calculations, or optimization over many parameters
- You need external data: News sentiment, economic calendars, alternative data, custom CSV/database feeds, or REST APIs
- You need portfolio control: Risk across multiple strategies, correlation limits, or capital allocation rules
- You need precision: Exact control over intrabar order generation, bar updating, and order types
A common path is to prototype in PowerLanguage, then rebuild the validated idea in C# for production. You keep the speed of prototyping and gain the robustness of .NET.
Common Use Cases for Advanced Traders
Traders who invest in custom MultiCharts .NET programming usually need one of these:
1. Proprietary Indicators — Custom volume profile, order flow delta, session VWAP with standard deviation bands, volatility-adjusted momentum, market breadth, or a composite indicator that combines price, volume, and volatility into one signal.
2. Custom Strategies — Mean-reversion, breakout, trend-following, or pairs strategies with dynamic position sizing, regime filters, and custom exit logic that built-in strategies cannot express.
3. Automated Execution Tools — Dashboards that show trade signals across a watchlist, alert systems that trigger on multi-condition setups, or semi-automated tools that calculate position size and place orders with predefined risk.
4. Data and Integration Tools — Indicators that pull in external data — for example, importing a custom index, reading from a database, or calling a web API — and plot it alongside price.
5. Research and Backtesting Systems — Walk-forward testing frameworks, custom performance metrics, and optimization tools that go beyond the standard report.
If your edge depends on a unique calculation or workflow, it probably belongs in custom code, not in a standard indicator.
Best Practices for Reliable C# Indicators and Strategies
Custom code is powerful, but it needs discipline. These practices separate professional studies from fragile scripts.
- Initialize once, calculate per bar: Do heavy setup in
Create(), not inCalcBar(). Re-creating objects on every bar kills performance. - Guard against insufficient bars: Check
Bars.CurrentBarbefore accessing historical values. Many errors come from trying to readClose[50]when only 10 bars exist. - Use variable series correctly: Store intermediate values in
VariableSeries<T>so they persist correctly across bars and during historical vs. real-time calculation. - Separate logic from plotting: Keep your signal logic pure. Plotting should be a thin layer on top, not mixed into every calculation.
- Test on multiple markets and timeframes: A strategy that works only on one symbol and one timeframe is likely overfit. Test for robustness.
- Log and debug: Use
Output.WriteLineduring development, test in visual mode, and verify that historical and real-time calculations match. - Version your code: Save versions of your indicators and strategies. You will want to compare v1 vs. v2 after optimization.
- Document inputs: Name inputs clearly and set sensible defaults. A good indicator should be usable by someone else without reading the code.
PowerLanguage vs. C#: Quick Comparison
| Feature | PowerLanguage | C# in MultiCharts .NET |
|---|---|---|
| Learning curve | Low, trading-focused | Higher, full programming language |
| Speed of prototyping | Very fast | Fast once structure is set |
| Complex math and statistics | Limited | Full .NET libraries |
| Object-oriented design | Limited | Full classes, inheritance, interfaces |
| External APIs and data | Difficult | Native .NET support |
| Multi-symbol / portfolio logic | Limited | Strong |
| Performance | Good for simple studies | Excellent for heavy calculations |
| Best for | Quick ideas, simple studies | Production systems, proprietary tools |
The best traders do not pick one and ignore the other. They use PowerLanguage for exploration and C# for execution.
When to Get Custom Development Help
You can learn MultiCharts .NET development yourself, and many traders do. But custom programming becomes a business decision when time, complexity, or reliability matters.
Consider professional help if you need to convert a complex TradingView, NinjaTrader, or Excel model to MultiCharts .NET without losing logic, build a proprietary indicator that must be protected as a compiled study, run a strategy reliably in live trading, integrate an external data source or API, or build a full system — indicator + strategy + dashboard + risk management — as one coherent codebase.
That is the core of MultiCharts .NET Custom Development Services. A specialist can architect the study correctly from the start, so you do not spend months debugging bar-by-bar logic, order generation, or performance issues.
For broader projects — including multi-platform tools, desktop applications, or custom trading infrastructure beyond MultiCharts — explore Custom Trading Software Development Services.
Final Takeaway
MultiCharts .NET indicator development is not just about writing more code. It is about building tools that match how you actually trade.
Start by understanding the environment: the editor, the compiled DLL, and the bar-by-bar flow. Learn the indicator structure — inputs, Create(), CalcBar(), and plots. Then decide honestly: is this idea simple enough for PowerLanguage, or does it need the structure, speed, and extensibility of C#?
If your edge is unique, your tools should be too. C# in MultiCharts .NET gives you the control to build that edge, test it rigorously, and trade it with confidence.