EMA Slope vs Crossover: What Moving Averages Confirm and What They Miss
An exponential moving average (EMA) is a smoothed view of closing prices, not an independent forecast. Two popular ways to read it—its slope and a crossover—answer different questions. Slope describes whether the average itself is rising or falling. A crossover compares two averages with different response speeds. Neither proves that the next price move will follow the signal.
1. How the EMA is calculated
For an N-period EMA, the smoothing factor is alpha = 2/(N+1). The recursive update is EMA(t) = alpha × Close(t) + (1 − alpha) × EMA(t−1). Implementations may initialize the first EMA using an SMA or the first available price, so early readings can differ. A 20-period EMA has alpha = 2/21 ≈ 0.09524. At a previous EMA of 100 and new close of 102, the updated EMA is about 100.1905—not 102. This illustrates smoothing and lag.
2. Slope measures direction, not strength by itself
A basic slope measure is EMA(t) − EMA(t−k), for a chosen lookback k. Positive values mean the average increased over that window; negative values mean it decreased. Because the raw difference depends on instrument price and k, it should not be compared across unrelated assets without normalization. One option is percentage slope: 100 × [EMA(t)/EMA(t−k) − 1], provided the denominator is positive. Slope near zero can describe a range, but a small slope alone does not establish that a market is safe or stable.
3. What a crossover actually says
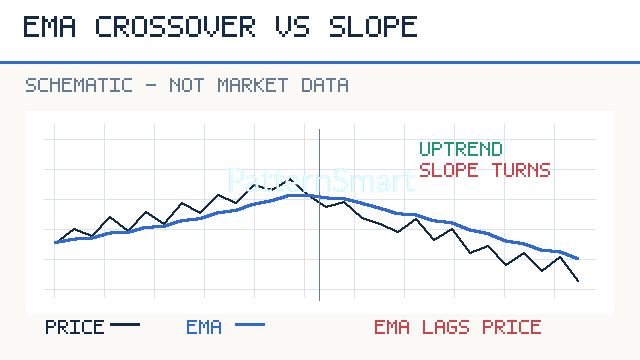
A bullish 10/30 EMA crossover occurs when the 10-period EMA moves from at or below the 30-period EMA to above it, evaluated on completed bars. It says recent prices have lifted the faster average relative to the slower one. It does not imply that the market has just begun an uptrend: by the time the averages cross, part of the price move has usually occurred. In sideways conditions, repeated crossings can produce whipsaws.
4. A practical, hypothetical comparison
Consider a market whose closing price rises from 100 to 106 over several sessions. Suppose the 10 EMA is 102.4 and the 30 EMA is 101.8 after the latest completed bar. The faster average is above the slower one, but that alone is insufficient: did the cross occur today or five bars ago? Is price breaking a prior swing high or approaching resistance? Is the 30 EMA rising, flat, or falling? A stronger analytical checklist asks for (a) a completed-bar crossover or established positive alignment, (b) a rising slower EMA, (c) a price structure of higher highs and higher lows, and (d) a predefined invalidation level. These are context checks, not a guaranteed profitable system.
In a different hypothetical case, the 10 EMA is 100.8 and the 30 EMA is 101.1 while price has already rebounded sharply. A crossover-based trader has no confirmed bullish cross yet; an early-entry trader may act sooner but accepts more false positives. That is a tradeoff, not a defect in the calculation.
5. How to avoid common mistakes
- Reading the live bar as final: an EMA and its crossover can change before the bar closes. Compare completed bars when the method requires close confirmation.
- Ignoring regime: trend-following signals may be repeatedly reversed in a narrow range.
- Changing parameters after seeing outcomes: choosing 9/21, 10/30 or 20/50 to fit a past chart can overfit noise.
- Confusing slope with momentum: an upward EMA slope does not establish that price acceleration is increasing.
- Ignoring costs and risk: spreads, commissions, slippage and gaps can dominate small apparent edges.
6. A disciplined validation workflow
Specify the instrument, bar interval, session, price source, EMA periods, initialization, and signal rule before testing. Use historical data that reflects corporate actions where relevant. Define entries and exits without future bars, include realistic costs, and evaluate out-of-sample periods and sideways as well as trending markets. Record false signals, maximum adverse excursion, drawdown, and sensitivity to parameter changes. Avoid treating a single attractive example as evidence of predictive power.
For traders implementing custom EMA diagnostics or bar-close alerts, Custom Trading Software Development Services can help translate a clearly defined analytical rule into platform-specific tooling.
Conclusion
EMA slope describes the direction of a smoothed price series; an EMA crossover compares two smoothing speeds. Both are backward-looking summaries. Their value comes from combining clear definitions with price structure, confirmation rules and honest testing—not from assuming any crossing predicts the next candle.
Risk disclaimer: This article is educational, not personalized investment advice. Trading involves loss risk; stop orders may execute at worse prices during gaps or illiquid conditions. No indicator guarantees results.