MT5 Closed-Bar EMA Crossover Arrows: Complete MQL5 Indicator Using iMA and CopyBuffer
MetaTrader 5 distinguishes indicator handles from calculated indicator values. This tutorial builds a full chart-window custom indicator that draws arrows when a fast exponential moving average crosses a slower one on a completed candle. The program does not place orders and does not predict future returns.
Calculation and signal contract
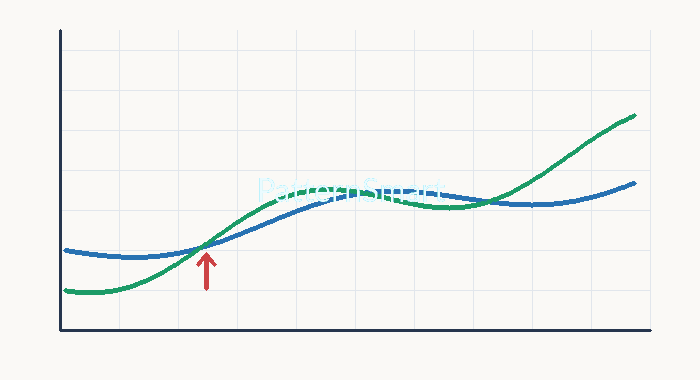
For closing price P(t) and EMA length N, EMA(t) = alpha × P(t) + (1 − alpha) × EMA(t−1), where alpha = 2/(N+1). The default fast length is 12 and the slow length is 26. On closed bar i, a bullish crossover occurs when FastEMA[i] > SlowEMA[i] and FastEMA[i+1] <= SlowEMA[i+1]. A bearish crossover reverses both inequalities. MQL5 series index 0 denotes the live, incomplete bar; index 1 is the latest closed bar. Therefore the script deliberately never plots a signal at index 0.
Configuration
FastPeriod (12): fast EMA length. SlowPeriod (26): slow EMA length, strictly greater than FastPeriod. ArrowOffsetPoints (100): visual distance from the bar low or high, in symbol points, not pips. The program uses PRICE_CLOSE, MODE_EMA and the current chart timeframe.
Complete MQL5 source code
Save the following complete listing as PS_Confirmed_EMA_Cross.mq5 in MQL5/Indicators. It uses two DRAW_ARROW indicator plots and separate iMA handles; CopyBuffer reads their numeric values.
// MT5 closed-bar EMA crossover arrows; no trading orders.
#property copyright "PatternSmart"
#property version   "1.00"
#property indicator_chart_window
#property indicator_buffers 2
#property indicator_plots   2
#property indicator_label1  "Bullish EMA Cross"
#property indicator_type1   DRAW_ARROW
#property indicator_color1  clrSeaGreen
#property indicator_width1  2
#property indicator_label2  "Bearish EMA Cross"
#property indicator_type2   DRAW_ARROW
#property indicator_color2  clrCrimson
#property indicator_width2  2

input int FastPeriod = 12;
input int SlowPeriod = 26;
input int ArrowOffsetPoints = 100;

double UpArrow[];
double DownArrow[];
int fastHandle = INVALID_HANDLE;
int slowHandle = INVALID_HANDLE;

int OnInit()
{
   if(FastPeriod < 1 || SlowPeriod <= FastPeriod || ArrowOffsetPoints < 0)
      return INIT_PARAMETERS_INCORRECT;
   SetIndexBuffer(0, UpArrow, INDICATOR_DATA);
   SetIndexBuffer(1, DownArrow, INDICATOR_DATA);
   ArraySetAsSeries(UpArrow, true);
   ArraySetAsSeries(DownArrow, true);
   PlotIndexSetInteger(0, PLOT_ARROW, 233);
   PlotIndexSetInteger(1, PLOT_ARROW, 234);
   PlotIndexSetDouble(0, PLOT_EMPTY_VALUE, EMPTY_VALUE);
   PlotIndexSetDouble(1, PLOT_EMPTY_VALUE, EMPTY_VALUE);
   IndicatorSetString(INDICATOR_SHORTNAME, "Confirmed EMA Cross");
   fastHandle = iMA(_Symbol, PERIOD_CURRENT, FastPeriod, 0, MODE_EMA, PRICE_CLOSE);
   slowHandle = iMA(_Symbol, PERIOD_CURRENT, SlowPeriod, 0, MODE_EMA, PRICE_CLOSE);
   if(fastHandle == INVALID_HANDLE || slowHandle == INVALID_HANDLE)
      return INIT_FAILED;
   return INIT_SUCCEEDED;
}

void OnDeinit(const int reason)
{
   if(fastHandle != INVALID_HANDLE) IndicatorRelease(fastHandle);
   if(slowHandle != INVALID_HANDLE) IndicatorRelease(slowHandle);
}

int OnCalculate(const int rates_total, const int prev_calculated,
                const datetime &time[], const double &open[],
                const double &high[], const double &low[],
                const double &close[], const long &tick_volume[],
                const long &volume[], const int &spread[])
{
   if(rates_total < SlowPeriod + 3) return 0;
   if(BarsCalculated(fastHandle) < rates_total ||
      BarsCalculated(slowHandle) < rates_total) return prev_calculated;
   double fast[], slow[];
   ArraySetAsSeries(fast, true);
   ArraySetAsSeries(slow, true);
   if(CopyBuffer(fastHandle, 0, 0, rates_total, fast) != rates_total ||
      CopyBuffer(slowHandle, 0, 0, rates_total, slow) != rates_total)
      return prev_calculated;
   ArraySetAsSeries(high, true);
   ArraySetAsSeries(low, true);
   // Full recomputation is intentionally simple and deterministic.
   // Index 0 is never signaled because its candle is incomplete.
   for(int i = rates_total - 1; i >= 0; --i)
   {
      UpArrow[i] = EMPTY_VALUE;
      DownArrow[i] = EMPTY_VALUE;
      if(i == 0 || i + 1 >= rates_total) continue;
      bool bullish = fast[i] > slow[i] && fast[i+1] <= slow[i+1];
      bool bearish = fast[i] < slow[i] && fast[i+1] >= slow[i+1];
      if(bullish) UpArrow[i] = low[i] - ArrowOffsetPoints * _Point;
      if(bearish) DownArrow[i] = high[i] + ArrowOffsetPoints * _Point;
   }
   return rates_total;
}
Installation and practical example
Open MetaEditor from MetaTrader 5, create a custom indicator file in MQL5/Indicators, replace its contents with the listing, compile it, and attach it to a chart. On a hypothetical bar, if the prior completed candle has FastEMA=1.0840 and SlowEMA=1.0842, while the latest completed candle has FastEMA=1.0846 and SlowEMA=1.0844, the bullish condition is true and an arrow appears below the latest completed candle. These values are illustrative, not a backtest.
Engineering notes and limitations
iMA returns a handle, not the EMA value; CopyBuffer retrieves the buffer. BarsCalculated and CopyBuffer guard against incomplete indicator calculation. The indicator intentionally recomputes all historical bars on each call, prioritizing simple deterministic behavior over efficiency on very large charts. On a live candle, EMA values and crosses can change; this implementation avoids drawing arrows on that candle. Broker history revisions can still alter historical calculations. Crossing EMAs lag price and can whipsaw in ranging markets. ArrowOffsetPoints may need adjustment across symbols and decimal conventions. No higher-timeframe request or lookahead is used.
Validation checklist
Check MetaEditor compilation, indicator loading, both plot colors and arrow positions, index-0 suppression, bullish and bearish comparisons on bars 1 and 2, short-history handling, missing-history behavior, performance on long histories, and visual consistency across symbols and timeframes. Confirm all code lines remain intact when copied from WordPress. No compilation, forward test, or live-market test has been performed for this article.
Customization and risk
Interested in this free indicator and want to customize, extend, or modify it for your own needs? Explore our Custom Trading Software Development Services to discuss your requirements.
Educational software only. Crossover arrows are not trading advice, can produce false signals, and offer no guarantee of profitability. Validate on historical and demo data and apply independent risk controls before any live use.