MultiCharts .NET ATR-Buffered Channel Breakout: C# Indicator Design and Validation
Overview
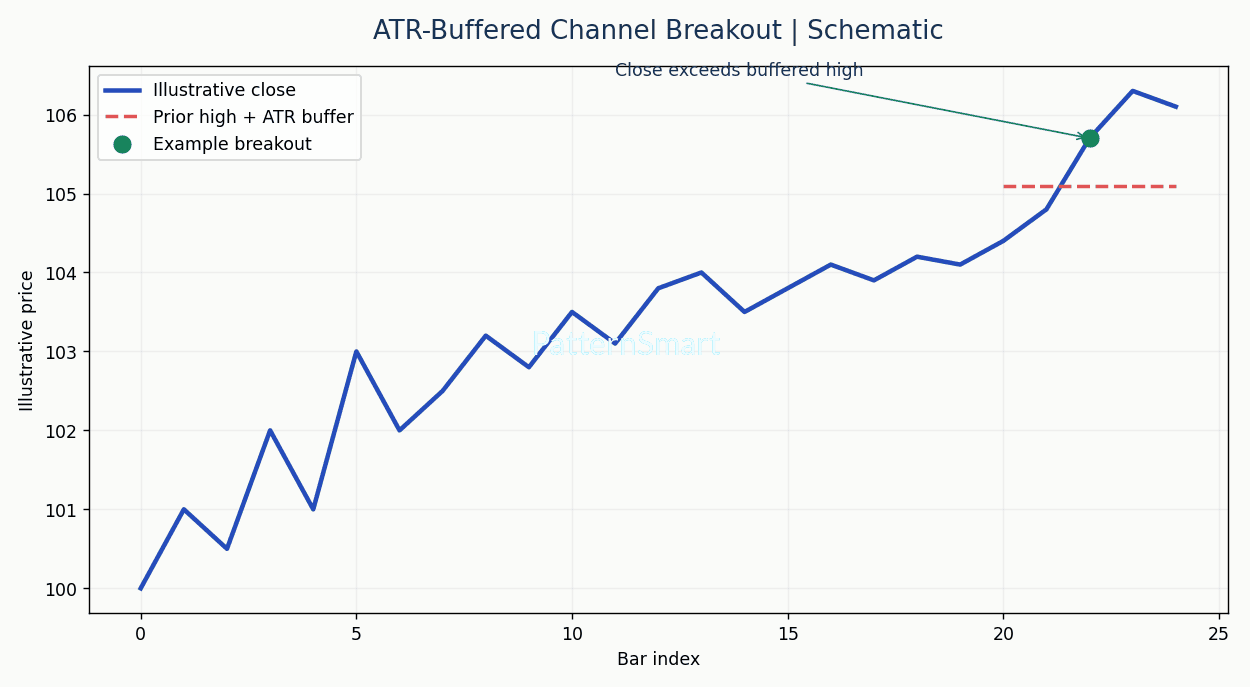
This indicator design identifies a close above the highest high of the preceding 20 bars, plus a fraction of a 14-bar Wilder ATR. The buffered threshold helps distinguish marginal touches from stronger closes.
Calculation
True range = max(high−low, |high−previous close|, |low−previous close|). Wilder ATR = (prior ATR × (length−1) + current true range) / length. Threshold = highest prior high + multiplier × ATR. A breakout occurs when the close exceeds the threshold and the previous close did not.
Inputs and example
Lookback=20, AtrLength=14, AtrMultiplier=0.25. For prior high 105.00 and ATR 2.00, the trigger threshold is 105.50; a close of 105.70 qualifies only if the prior close was at or below the current threshold.
Complete C# source (requires platform compilation validation)
using System;
using System.Drawing;
using PowerLanguage;
using PowerLanguage.Function;

namespace PowerLanguage.Indicator
{
    // Closed-bar breakout with a volatility-based buffer.
    // This study plots a reference level and a breakout marker.
    public class PS_ATRChannelBreakout : IndicatorObject
    {
        private VariableSeries<double> atr;
        private IPlotObject upperPlot;
        private IPlotObject signalPlot;

        [Input]
        public int Lookback { get; set; } = 20;

        [Input]
        public int AtrLength { get; set; } = 14;

        [Input]
        public double AtrMultiplier { get; set; } = 0.25;

        public PS_ATRChannelBreakout(object ctx) : base(ctx) { }

        protected override void Create()
        {
            atr = new VariableSeries<double>(this);
            upperPlot = AddPlot(new PlotAttributes("PriorHigh", EPlotShapes.Line, Color.Blue));
            signalPlot = AddPlot(new PlotAttributes("Breakout", EPlotShapes.Point, Color.Green));
        }

        protected override void CalcBar()
        {
            // True range is the maximum of three bar-to-bar ranges.
            double prevClose = Bars.Close[1];
            double tr = Math.Max(Bars.High[0] - Bars.Low[0],
                Math.Max(Math.Abs(Bars.High[0] - prevClose),
                         Math.Abs(Bars.Low[0] - prevClose)));
            // Wilder smoothing; seed uses the first available TR.
            atr.Value = Bars.CurrentBar <= 1 ? tr :
                (atr[1] * (AtrLength - 1) + tr) / AtrLength;

            if (Bars.CurrentBar <= Math.Max(Lookback, AtrLength) + 1)
                return;

            double priorHigh = double.MinValue;
            for (int i = 1; i <= Lookback; i++)
                priorHigh = Math.Max(priorHigh, Bars.High[i]);

            double threshold = priorHigh + AtrMultiplier * atr.Value;
            upperPlot.Set(threshold);
            if (Bars.Close[0] > threshold && Bars.Close[1] <= threshold)
                signalPlot.Set(Bars.Low[0]);
        }
    }
}
Installation and validation
Create a new C# indicator in MultiCharts .NET PowerLanguage Editor, paste the source, compile and test on a historical chart. Confirm API signatures against your installed SDK. This supplied source has not been compiled or run and must be validated before live use.
Limitations and risk
The current bar can change until it closes; use bar-close calculations for stable signals. Wilder ATR initialization can differ across implementations. Gaps and volatility spikes can produce false signals. This indicator is educational and does not guarantee trading performance.
Interested in this free indicator idea and want it adapted to your trading workflow? Explore our Custom Trading Software Development Services.