Multiple
Time Frames or Multi time frames (MTF) is a very popular term in
Technical Analysis. It refers to the method of applying higher timeframe
price data on current or lower timeframe.
What’s higher timeframe?
Any
timeframe that is higher than the current chart’s timeframe is defined
as higher timeframe. If we apply Weekly price data on a Daily chart,
Weekly is considered as higher timeframe relative to Daily timeframe.
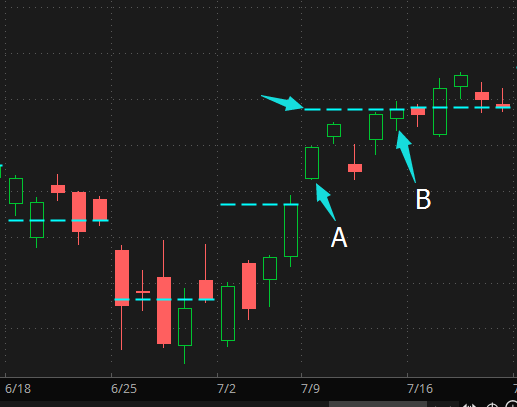
The image below is a simple demonstration of the plot of current Weekly
Close price on Daily chart. Bar A is Monday and bar B is Friday, the
dash line is the value of Weekly Close price which is also the Close of
the bar B. The problem is that we don’t know the value of the dash line
until the end of Friday’s trading session. The plot in the chart below
is historical data that’s why it can draw the Close of bar B on bar A.
If it’s on realtime data, the dash line will repaint itself from bar A to bar B until B is finished.
The image below is the plot of last Weekly Close price on Daily chart. Bar A is the same bar as the chart above. In this case, the dash line will not repaint since the value is Previous Friday’s Close, which is formed already.

Multiple time frames does not equal to repainting.
When creating indicators, if
you used unfinished higher timeframe price or volume data to plot
something you will encounter repainting issue. But it will not repaint
if you used finished previous higher timeframe data.
For example, if you created a Multiple time frames moving average which used current weekly price(unknown value), when you use it on a daily chart, the line plot of weekly moving average will keep changing itself until the end of this week’s trading session.
If you used previous weeks price instead current weekly price, the line plot of weekly moving average will be a fixed value, because
the previous weekly price is a known value.