The TPR(Trend Pullback Reversal) indicator forms a possible price trend line and the trend line can be used as support & resistance level, it also provides Pullback and Reversal signals.
TPR works on all timeframes and all symbols and all type of bar chart.
TPR never repaints.
There are 4 Parameters:
- Period: number of bars used for calculations
- Factor: Multiplier factor, small number for short trend, large number for long trend
- ShowSignal: enable to show the signal dots
- ShowBand: enable to show band and center line
Click an image to view at full size.

We
use the same algorithm for the TPR on all platforms, it will work
exactly the same on any platform, you can also view some screenshot and
videos we took from other platforms.
This is a video of how TPR indicator on NT8 performs in a relatively long-term downtrend of Forex AUDUSD 5min chart.
You may think it looks like supertrend or braintrend, right?
Actually, most trend indicators have similar plot, the differences are where and when they give signals.
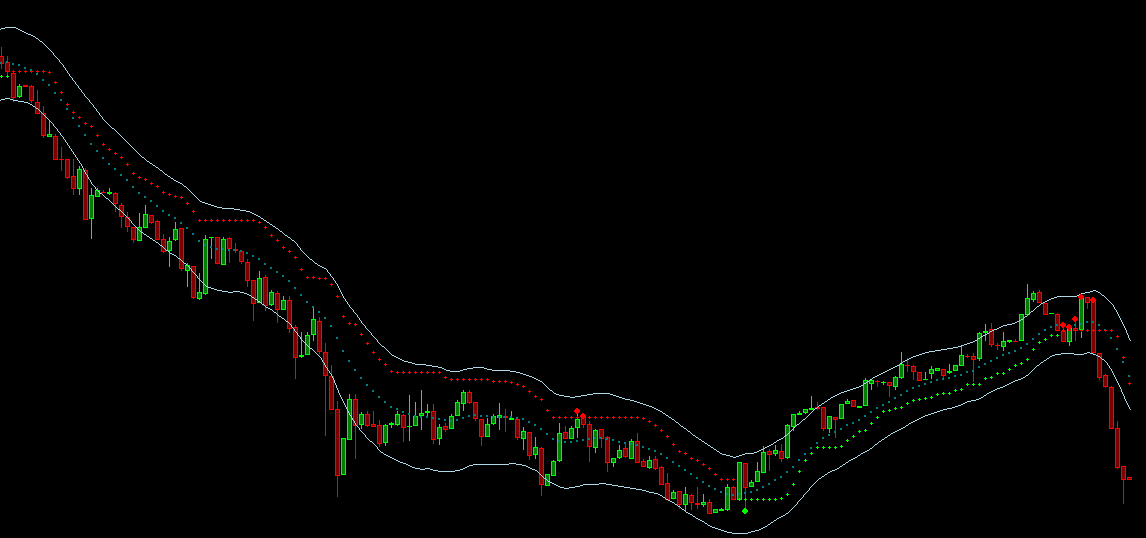
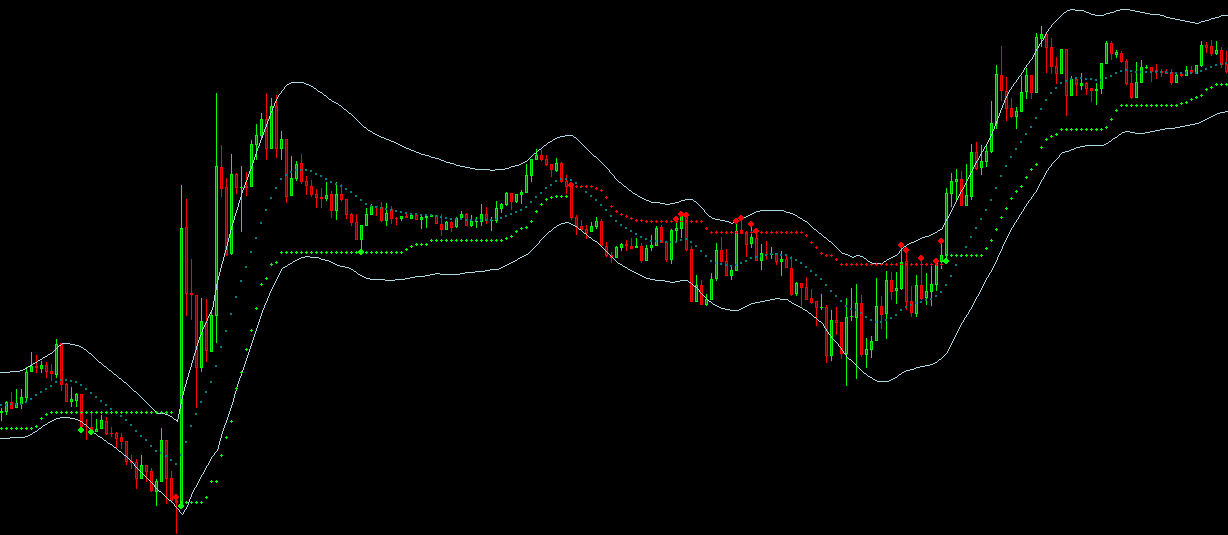
Unlike other trend indicators, TPR will focus on the main trend and filter out most minor price movements. The green cross-line represents an uptrend, the red cross-line represents a downtrend and the blue dots are signals for possible reversals.
The additional band and center line may look like bollinger band, but the TPR band algorithm is completely different from bollingerband. There is no standard deviation in TPR band calculation.
The following image is a comparison of TPR and BOLL.
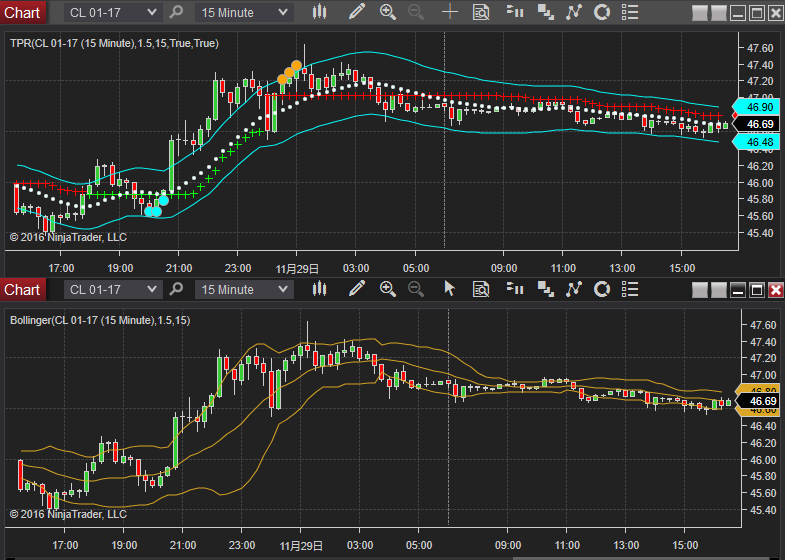
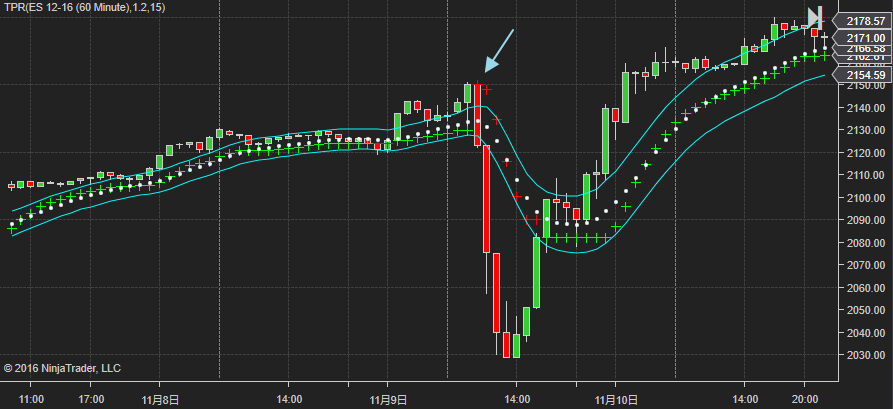
The TPR band gives a possible range of the TPR movement, if TPR is outside the band for many bars or far away from the band, it could be a sign of trend reversal.
The chart below is an example of TPR outside of band.
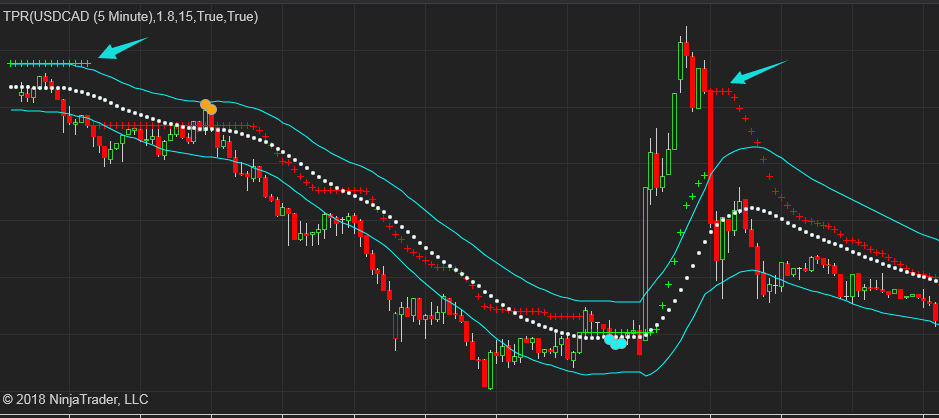
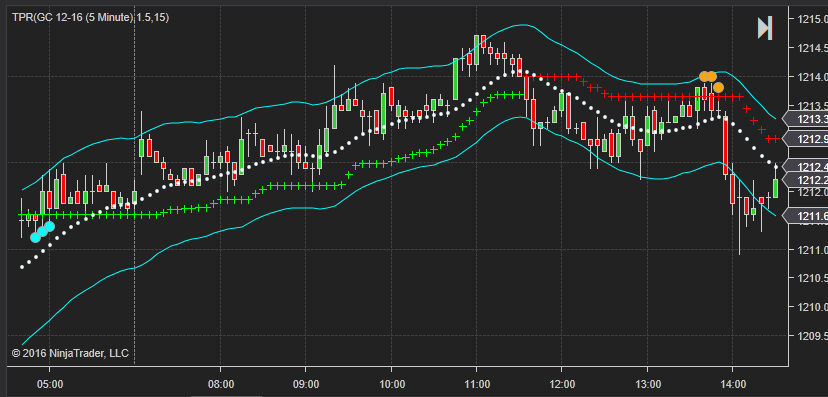
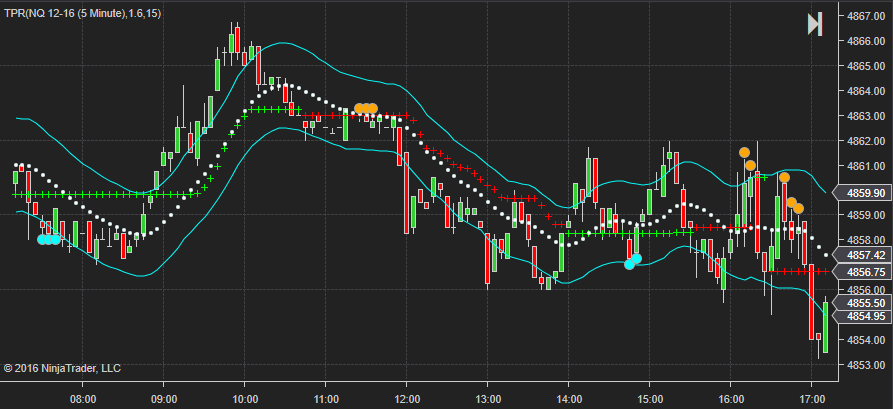
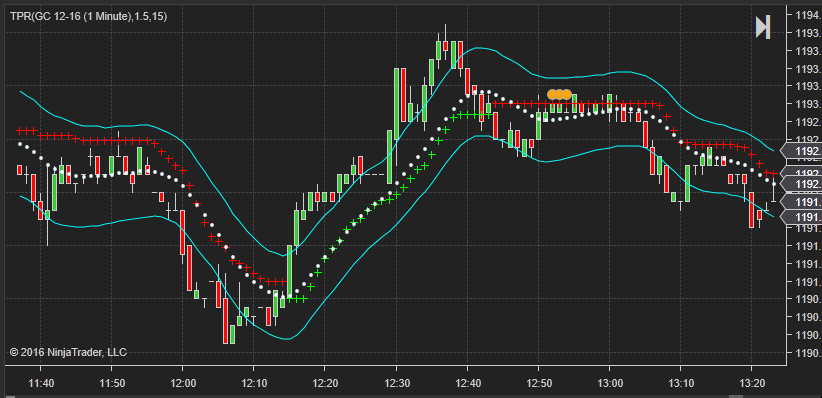
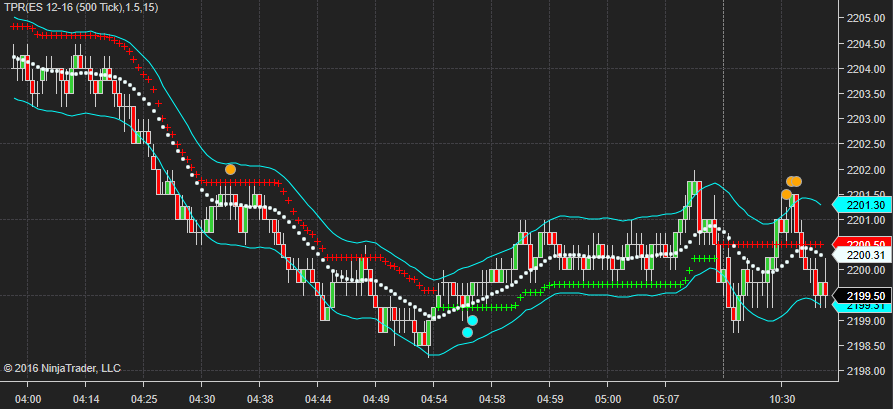
You can see how TPR reacts to price movement from the following images.
The orange and cyan dots give possible reversal signals.
If you are familiar with Supertrend indicator, you may think the TPR is almost the same as Supertrend. In this case, you should read the following content.
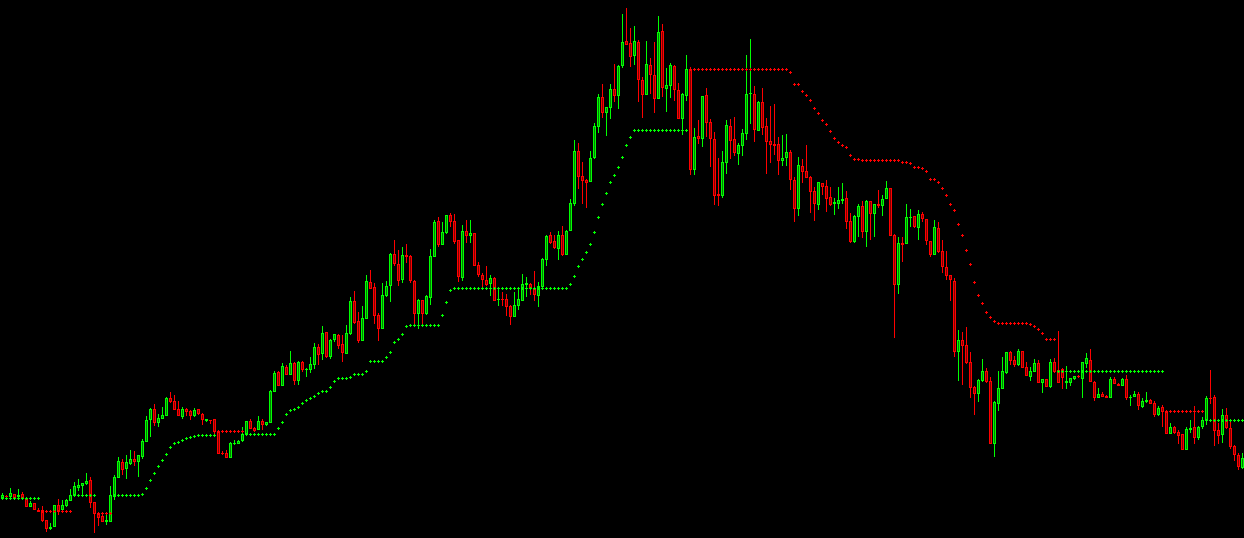
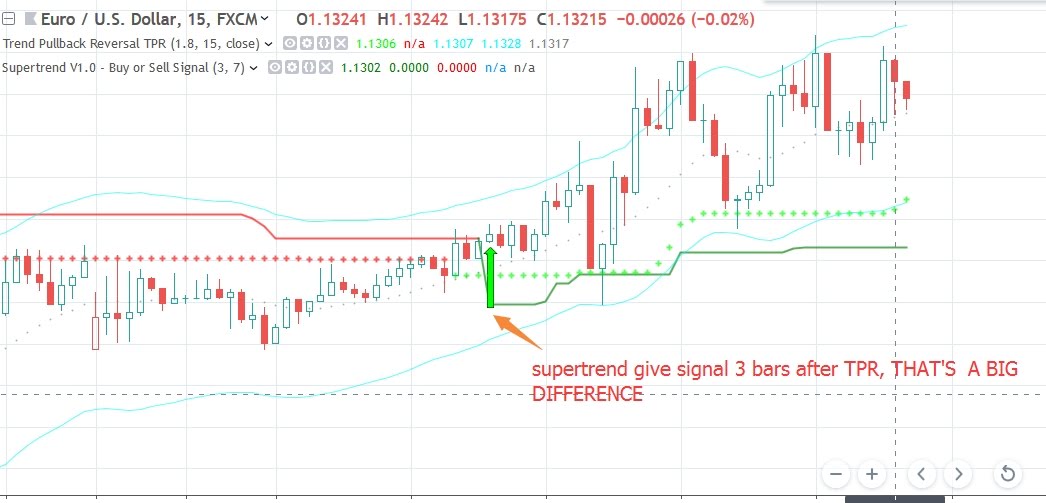
If only check the line plot from both Supertrend and TPR, it’s easier to notice that TPR may change trend earlier than supertrend, as shown in the charts below, but that’s not the main difference between them.
The most important difference between TPR and supertrend is that TPR can be used as a support and resistance indicator as well, not just a trend indicator.
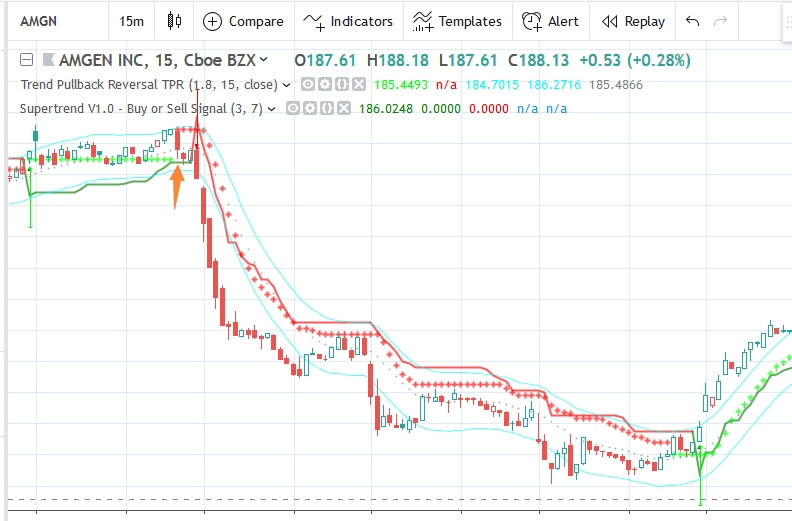
The following 2 charts have both TPR and supertrend. The solid line is from supertrend, the cross line is TPR.
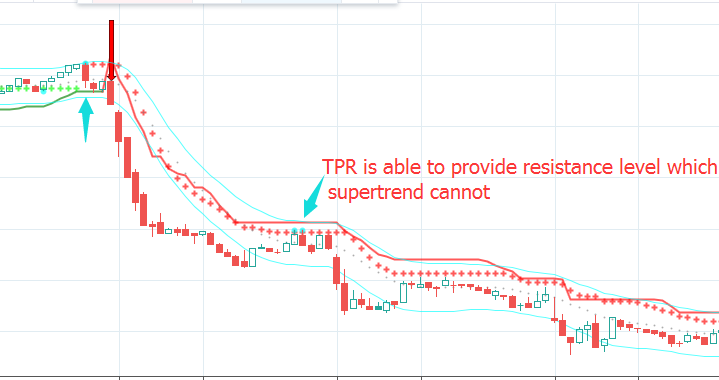
As you can see, the line from TPR provides a very good support and resistance level, but supertrend is far away from the price bar which cannot be used as support and resistance level at all.

In short, if you only need a trend indicator, both TPR and Supertrend will do the job.
But if you also want it to provide support and resistance level, TPR is much better than supertrend.
For more screenshots please visit: https://t.co/JQacXoMsNG