The three ETHUSD M30 charts show how Money Flow Double Divergence can add context to price action across different market ranges. Rather than treating each marked divergence as a standalone instruction, the examples illustrate a more disciplined process: observe the relationship between price and buying or selling pressure, evaluate the surrounding structure, and wait for confirmation.
Money Flow evaluates participation and the balance between buying and selling pressure. When price continues in one direction while the Money Flow oscillator no longer confirms that movement, the difference may indicate that conviction is changing. It is additional evidence—not a prediction.
The short-range example: repeated hidden divergence and a developing trend change
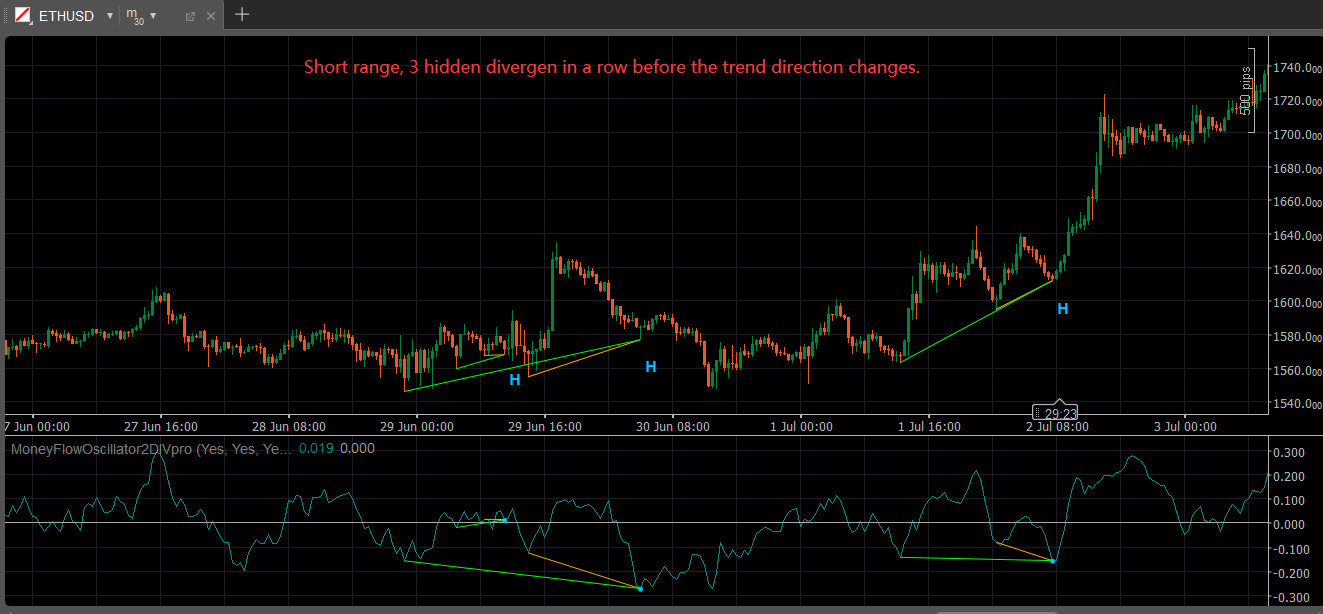
The first chart highlights a short-range sequence of three hidden-divergence observations before ETHUSD moves decisively higher. The repeated signals occur during a period of uneven price action rather than at a clean, immediate breakout.
Hidden divergence is commonly associated with trend continuation and pullbacks. In this example, the series of observations suggests that selling pressure during the declines was not fully aligned with the developing price structure. Each signal alone required caution, but their recurrence made the relationship between price and Money Flow increasingly relevant.
Confirmation arrived from price, not from the divergence labels alone. ETHUSD subsequently held its structure, moved through the nearby range, and expanded higher. The useful lesson is that repeated hidden divergence may strengthen the case for monitoring a continuation or directional shift, but a break in price structure remains the more independent confirmation.
The mid-range example: continuation evidence followed by a regular-divergence reversal setup
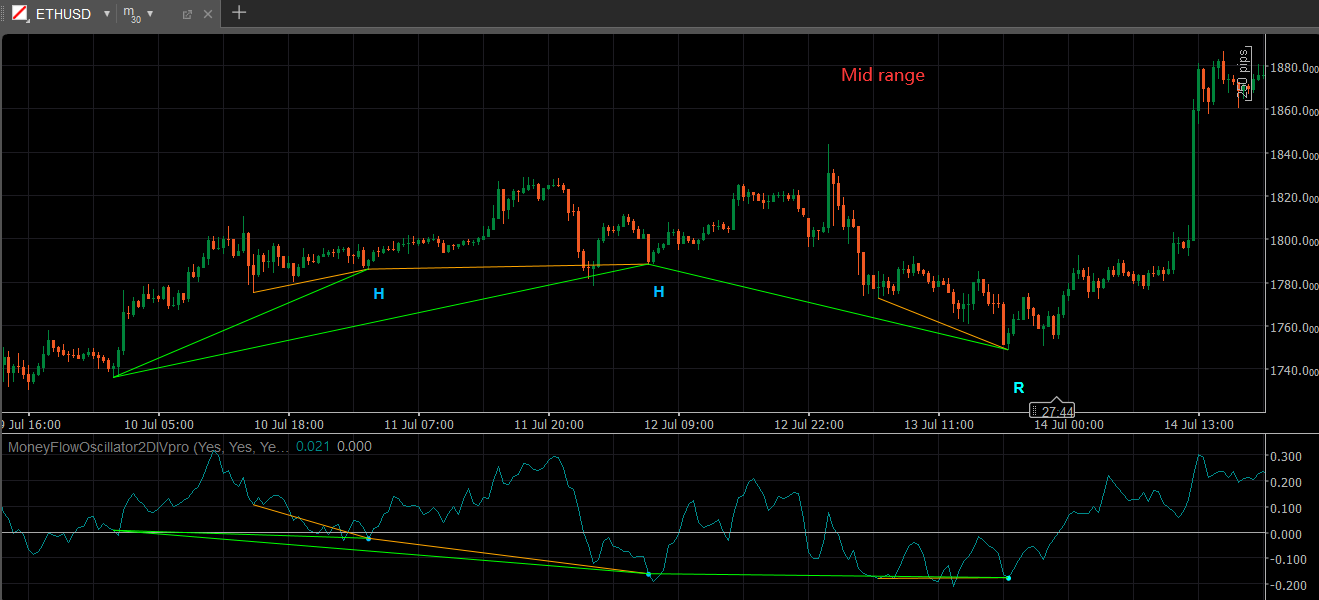
The second chart connects two hidden-divergence observations with a later regular-divergence signal.
Early in the example, the hidden-divergence markers appear as ETHUSD attempts to maintain a constructive structure. These observations suggest that the pullbacks may not have been supported by proportionate selling pressure. They therefore provided context for a possible continuation, provided price could preserve its relevant swing levels.
Later, the regular-divergence signal appears after the market has declined. Regular bullish divergence occurs when price forms a lower low while the oscillator forms a higher low. In Money Flow terms, that mismatch can indicate that price is pressing lower while selling pressure is becoming less convincing.
The subsequent advance illustrates how the two signal types can relate:
- Hidden divergence may help assess whether a pullback is compatible with an existing or developing trend.
- Regular divergence may help identify when an extended directional move deserves closer reversal analysis.
- Price confirmation—such as a higher low, recovery of a prior swing level, or break above resistance—determines whether the analytical case becomes stronger.
The sequence does not mean every hidden signal leads to a trend or every regular signal produces a reversal. It shows why signals are more informative when interpreted as part of a developing market narrative.
The long-range example: participation weakens near an extended high
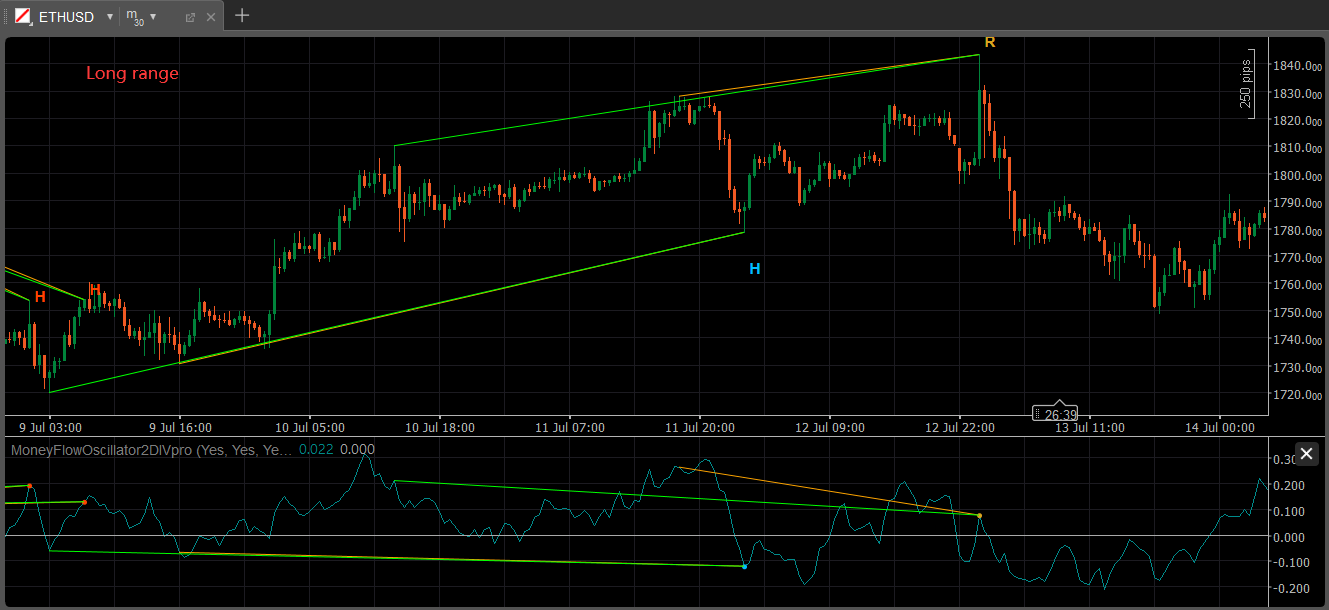
The third chart provides the wider context. Earlier hidden-divergence observations appear as ETHUSD advances through a longer upward phase. These signals align with the idea that temporary retracements can occur without invalidating the broader structure.
Near the later high, however, the chart marks a regular divergence. Price reaches a higher high while the Money Flow oscillator forms a lower high. This can suggest that the advance is continuing on the chart, but buying pressure is no longer confirming it to the same degree.
The later decline demonstrates why this change in participation deserved attention. It did not make a decline certain at the moment of the signal; price could have continued higher. But the combination of an extended advance, a new price high, and weaker Money Flow created a reasonable case to reduce confidence in uninterrupted bullish continuation and watch for price-based confirmation of a reversal.
Connecting the three charts
Together, the charts show a progression from short-range repetition to broader structural interpretation:
- Repeated hidden-divergence observations can draw attention to whether a pullback is losing countertrend pressure.
- Regular divergence can identify a mismatch between new price extremes and underlying participation.
- The meaning of either signal changes with the prevailing trend, nearby support or resistance, and subsequent price structure.
- A signal gains analytical value when independent evidence supports the same interpretation.
This is the central benefit of a confirmation-first approach. The Money Flow oscillator contributes a participation perspective, while price action supplies the primary evidence of whether the market is actually continuing, breaking down, or reversing.
A practical confirmation process
When a Money Flow Double Divergence signal appears, traders can ask:
- Is price trending, ranging, or testing a significant level?
- Does the signal align with a higher low, lower high, breakout, or failed breakout?
- Is there nearby support or resistance that gives the observation context?
- Has price confirmed the interpretation by breaking or reclaiming an important swing level?
- Is the available volume data reliable for the market and broker being analyzed?
For ETHUSD and other crypto-related CFD charts, volume quality can vary by broker. That limitation makes price action and market structure especially important as independent confirmation.
Conclusion
The charts demonstrate that Money Flow Double Divergence is most useful when it helps organize a changing relationship between price and market participation. Hidden-divergence observations can provide context during pullbacks, while regular divergence can highlight weakening support behind an extended move. Neither replaces price analysis.
Used within cTrader’s responsive charting workflow, the PatternSmart Money Flow Double Divergence Indicator can help traders monitor these relationships more systematically. The objective is not to predict every reversal or continuation, but to improve the quality of technical evaluation through context, confirmation, and disciplined interpretation.
Read the master guide on the Double Divergence Indicator Series.
Visit the Technical Inputs Manual: Double Divergence Pro for full parameter tuning.
The MoneyFlow Double Divergence Pro indicator is available in these platforms: Ctrader, MetaTrader(MT4, MT5), NinjaTrader 8, MultiCharts, MultiCharts x.NET, Tradingview(subchart only), Prorealtime(subchart only), SierraChart.Introduction to the Trend Pullback Reversal (TPR) Indicator