Introduction
Divergence analysis is most useful when it is treated as evidence—not as a prediction. A single price-and-indicator disagreement can draw attention to changing momentum, but its analytical value increases when it is examined alongside market structure, the broader trend, and other confirmed divergence relationships.
These BTCUSD cTrader charts illustrate that principle through MACD Double Divergence across three structural scopes: short range, mid range, and long range. The examples show how compact swing signals can coexist with broader momentum structures, and why traders benefit from evaluating them as related observations rather than isolated events.
MACD is particularly suited to this process because it combines moving-average relationships with momentum analysis. As a result, divergence can help highlight periods in which price continues to move while momentum no longer fully supports that move.
The Role of Structural Range
The Divergence Bar Range defines the structural search boundaries used to identify valid divergence anchor points. It does not change the Double Divergence methodology or confirmation logic. Instead, it changes the historical distance over which price and indicator swing points are compared.
- ShortRange focuses on relatively compact divergence structures.
- MidRange evaluates intermediate structural relationships.
- LongRange searches for broader historical divergence structures.
This distinction matters because a BTCUSD move can contain several layers of information at the same time. A short-range signal may describe a local momentum shift inside a larger trend, while a long-range structure may provide the context needed to judge whether that local shift represents a pullback, continuation, or a more meaningful transition.
Chart 1: Short-Range MACD Double Divergence
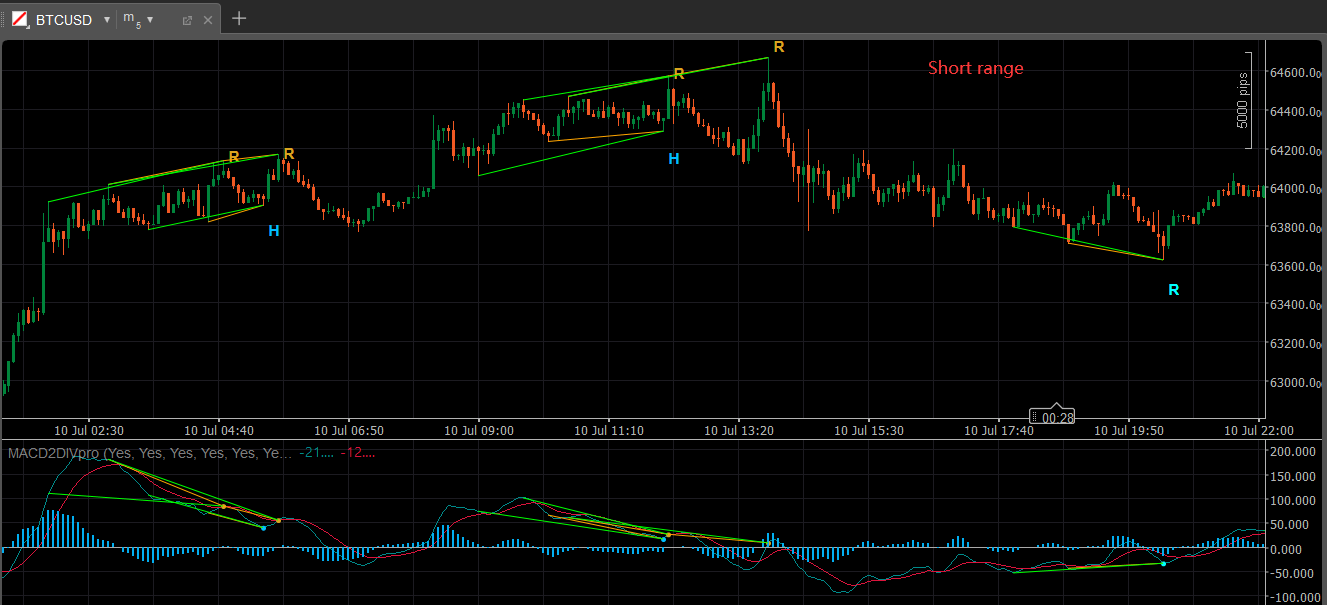
The first chart uses a short-range structural view. It identifies several nearby BTCUSD swing relationships, including regular divergence markers (R) and hidden divergence markers (H).
The early rising sequence contains regular bearish divergence: price extends higher while the corresponding MACD structure does not provide equivalent confirmation. This does not establish that price must reverse. It indicates that the upward move deserves closer scrutiny because momentum and price are no longer moving in complete agreement.
The hidden signals within the same chart add a different perspective. Hidden divergence is commonly associated with pullbacks and trend-continuation analysis. In this short-range setting, the hidden markers help frame local corrections within the prevailing swing structure rather than treating every loss of momentum as a reversal.
Later, another regular bearish structure appears near the intraday high, followed by lower price action. The important lesson is not that the divergence “caused” the decline. Rather, the signal highlighted a weakening relationship between price extension and MACD momentum before the market changed character.
Short-range analysis is therefore valuable for responsive chart reading, but it should be interpreted with care. Compact structures may occur frequently in an active market such as BTCUSD, making broader confirmation essential.
Chart 2: Mid-Range Divergence Based on MACD Avg
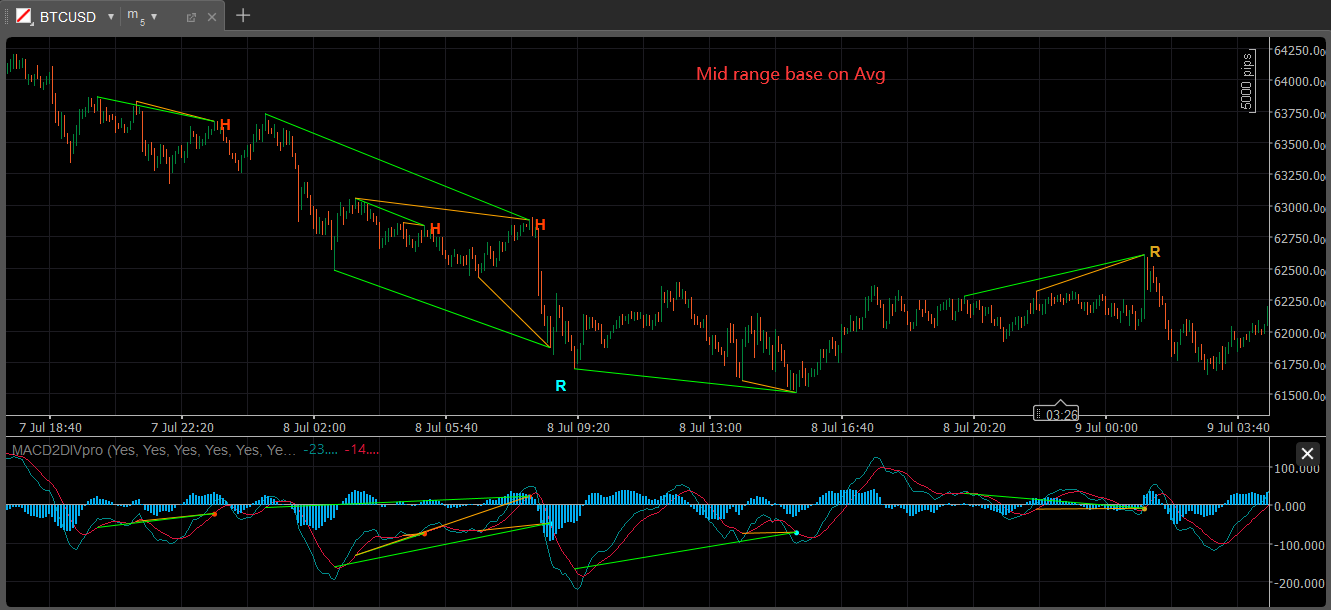
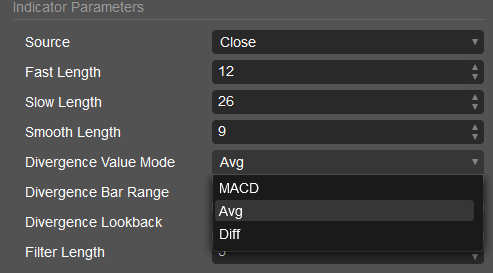
The second chart, labelled Mid range base on Avg, occupies the middle ground between local responsiveness and broad structural context. Here, the divergence relationship is evaluated against the displayed MACD Avg component.
During the decline, hidden bearish divergence appears around lower-high price structures. These observations are relevant because they suggest that countertrend bounces should be assessed carefully while the broader downward structure remains intact. The later regular bullish divergences near lower price lows draw attention to fading downside momentum and the possibility of a transition or corrective recovery.
Near the final upswing, regular bearish divergence appears as price pushes higher while the MACD Avg relationship does not provide matching confirmation. In isolation, this is only an observation of weakening alignment. In combination with nearby resistance, a loss of bullish price structure, or confirmation from the short-range MACD view, it may become more analytically significant.
The mid-range setting can be useful when traders want to evaluate meaningful swings without allowing every small fluctuation to dominate the analysis.
Chart 3: Long-Range Divergence Based on MACD Diff
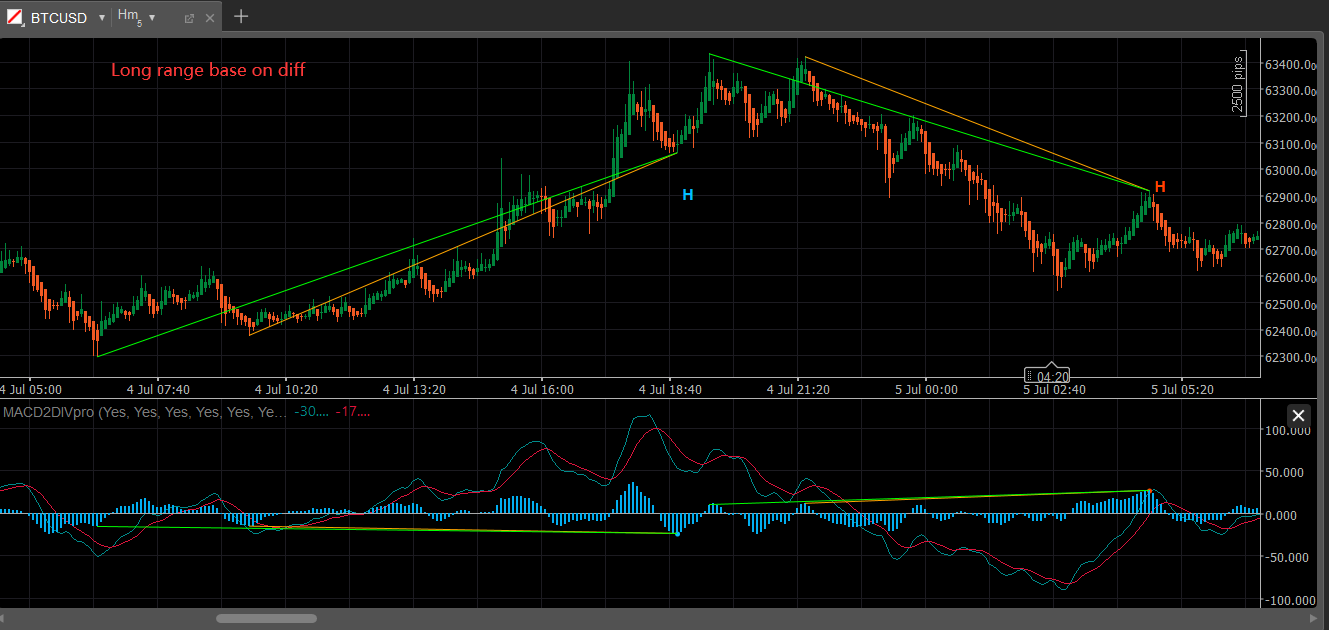
The third chart expands the structural perspective. The chart is indicating that the divergence comparison is based on the displayed MACD Diff component and evaluated over a broader historical relationship.
The earlier bullish hidden structure appears during the advance from the prior low. In context, this supports the idea that a correction within a developing upswing may have retained underlying momentum. Later, the chart identifies bearish hidden divergence as price forms a lower high while the MACD Diff structure presents the opposing relationship. This is consistent with analysing continuation pressure within the broader downswing that follows.
The long-range view does not replace the short-range chart. It provides hierarchy. It helps traders ask whether an intraday signal is working with, or against, the more established price structure and MACD momentum relationship.
When a short-range reversal-type observation develops against a still-valid longer-range continuation structure, the prudent interpretation is caution—not certainty. Price action must show whether the local signal can overcome the broader trend context.
How the Three Views Work Together
The charts form a practical confirmation framework:
| Structural view | Primary contribution | Question it helps answer |
|---|---|---|
| Short range | Local swing and momentum changes | Is the most recent move losing or rebuilding momentum? |
| Mid range | Intermediate market structure | Is the local signal developing within a meaningful swing? |
| Long range | Broader trend and continuation context | Does the larger price-and-momentum structure support the same interpretation? |
A stronger analytical case may develop when several observations align. For example, a long-range bearish continuation context, a mid-range bearish divergence near a lower high, and a short-range loss of upward momentum can collectively support a more cautious view of a bounce.
Conversely, a short-range bullish divergence against a broader bearish structure may identify a potential rally or loss of downside momentum, but it does not by itself invalidate the larger trend. That distinction helps prevent a common mistake: interpreting every divergence as an immediate reversal signal.
Confirmation: From Observation to Analysis
Double Divergence is a confirmation-based methodology. The goal is to improve the interpretation of present market conditions, not to predict a guaranteed future outcome.
Useful confirmation can include:
- A completed price bar and sustained price response after the divergence structure.
- A break or recovery of a relevant swing level.
- Support and resistance context.
- Alignment between short-, mid-, and long-range structures.
- The prevailing trend and the quality of the price structure.
- Additional technical evidence appropriate to the trader’s workflow.
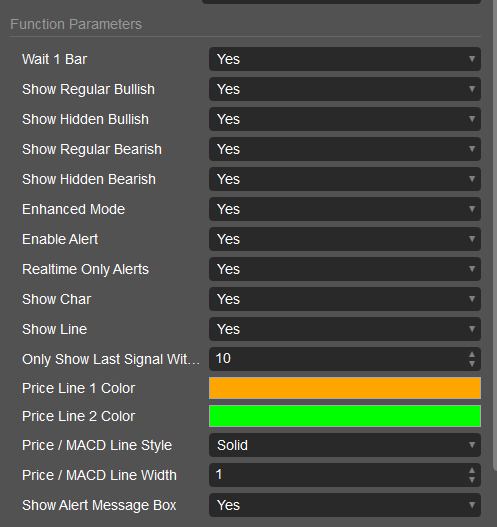
In Double Divergence Pro, Wait 1 Bar can require one completed confirmation bar before a detected signal is finalized. Enhanced Mode applies additional structural validation to eligible signals. These functions have distinct roles: Wait 1 Bar affects when a signal is confirmed, while Enhanced Mode affects whether an eligible structure meets additional validation. Neither replaces the trader’s evaluation of price action and market context.
A More Disciplined Way to Read MACD Divergence
The BTCUSD examples demonstrate why MACD divergence should be read as a structured conversation between price, momentum, and time horizon.
Short-range signals provide timely awareness of local momentum changes. Mid-range signals place those changes inside a more developed swing. Long-range signals provide the broader trend context that can help distinguish a potential reversal from a temporary correction.
Regular divergence can draw attention to a trend that may be losing momentum. Hidden divergence can help evaluate whether a pullback is compatible with underlying continuation. Neither type guarantees a market outcome. Their value comes from the additional context they provide when combined with confirmation and disciplined chart analysis.
For cTrader users, MACD Double Divergence can support a streamlined, responsive workflow by making these price-and-momentum relationships easier to identify and evaluate. The final decision, however, remains dependent on market structure, confirmation, and risk management.
Read the master guide on the Double Divergence Indicator Series.
Visit the Technical Inputs Manual: Double Divergence Pro for full parameter tuning.
The MACD Double Divergence Pro indicator is available in these platforms: Ctrader, MetaTrader(MT4, MT5), NinjaTrader 8, MultiCharts, MultiCharts x.NET, Tradingview(subchart only), Prorealtime(subchart only), SierraChart.Introduction to the Trend Pullback Reversal (TPR) Indicator