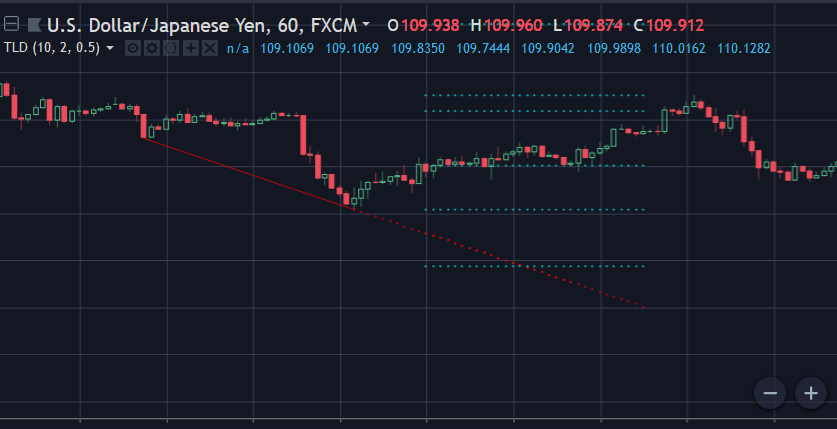
This is a customized Tradingview indicator will automatically plots descending trend lines which formed by two adjacent swing lows. It will also draw 5 extended resistance and support levels after the trend line detected.
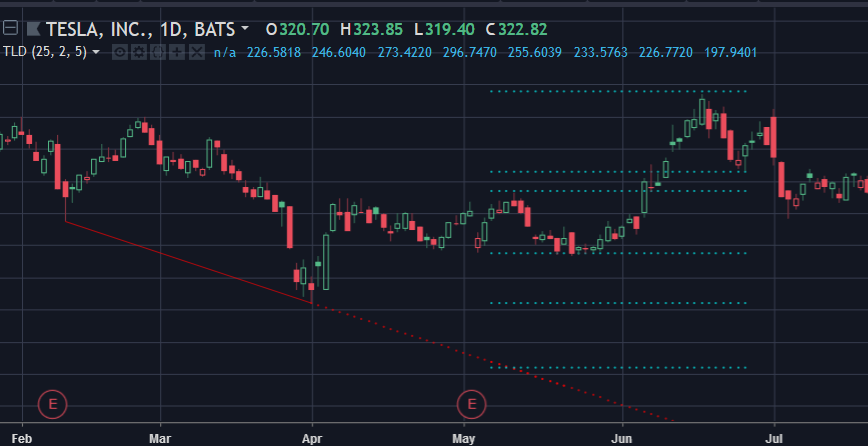
The concept is simple: the trend line is formed by two adjacent troughs when the price is in a downtrend . It will save a lot of time for people (like me) who uses trendline very often.
By deploying this indicator, should the condition meet, you don’t need to draw the trend lines by hand anymore. It’s also very easy to use, just load it on chart and set your desired inputs.
Features:
- Strength, this parameter is used to define the minimum number of bars to the left and right side of the troughs (swing low point).
For more details of this input please check: https://goo.gl/sWBH7k - Set price difference between two troughs in two variables: amount or percentage.
- Enable/disable the extended level lines.


By using different inputs, you can easily filter out some unwanted trend lines.
It’s recommended to use small value for price difference input on intraday chart, and use relatively large value on Daily chart.
The choice of price difference value input also depends on the market you work on, you may want to use small value on Forex market and use large value on Stock market.