Purchase link: Stock Option Volume and Open Interest indicator for Thinkorswim
This indicator will plot optionable Stocks Option Volume and Open Interest information on chart.
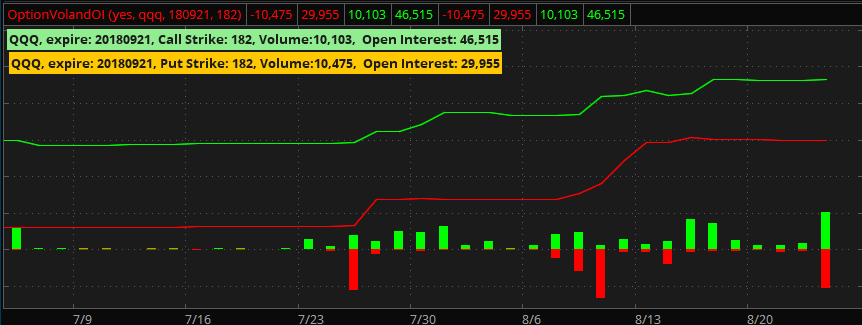
In default, the Option Volume will be plotted as histogram, and Open Interest will be lines.
Call is in green color and Put is in Red color.
The label text on the top left corner will display the latest bar’s info.
Features and inputs:
- If you chose Yes for “useCurrentSymbol”, the indicator will plot the Option info of the chart symbol.
- The second input “symbol” only works if you chose No for “useCurrentSymbol”, you can enter a desired symbol such as “qqq” which must be optionable, then the indicator will plot the Option info based on this symbol you entered.
- expire Date: this is the expiration date of the Option strike you want to check. Please use this format ONLY: YEAR/MONTH/DAY, YEAR, MONTH and DAY must be 2-digit number without any other letter or char.
- strikePrice: this is the Option strike price you want to check. Make sure the value you entered is a valid strike.

If you don’t want any of the plot on chart, simply uncheck “Show plot” option.

You can add more than one instance of this indicator on chart with different inputs for different purposes.
The chart below has three of this indicator added to chart, the first one has inputs of a weekly expired strike of current chart symbol which is QQQ.
The second one has a weekly expired strike of a input symbol which is SPY.
The Thrid one has inputs of a monthly expired strike of current chart symbol which is QQQ.

Hi I was hoping this was a free indicator but obviously not (lol) – how much is this indicator? I can probably find something similar searching the deep parts of the internet but would be easier to spend a few bucks.
https://www.patternsmart.com/cart/index.php?route=product/product&product_id=52&search=Stock+Option+Volume+and+Open+Interest+indicator+for+Thinkorswim