Divergence is very common and useful in technical analysis. It indicates possible reversal signals when there are discrepancies between RSI and price movement.
The definition of divergence is when price and indicator move in different direction,
for instance, when price is in uptrend and reaches a higher high where the indicator is in downtrend.

Update Notes: added hidden divergence type.
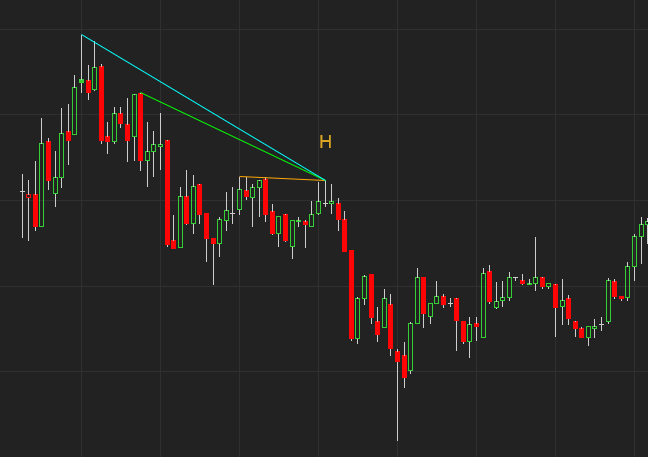
A hidden divergence is where price has a higher LOW but the indicator has a relative lower value, as shown in the pic below.

There will be a ‘H’ drawn under a hidden bullish divergence.
A ‘R’ drawn under a regular bullish divergence.

It also true if price has a lower HIGH but the indicator has a relative higher value.
There will be a ‘H’ drawn under a hidden bearish divergence.
A ‘R’ drawn under a regular bearish divergence.

What is RSI Triple Divergence?
The concept of triple divergence is intuitional, if there are three continueous divergences in a row between current High and previous Peak then it will trigger a signal.
For example, a bearish RSI triple divergence is shown in the chart below, bar A is current High and it has a RSI divergence with bar B which is previous peak. Divergence also exists between A and C (the 2nd previous peak) as well as A and D(the 3rd previous peak).

The following chart is a bullish RSI triple divergence. There is divergence between bar A and bar B (previous trough), bar A and bar C (2nd previous trough), bar A and bar D (3rd previous trough).

Why Triple Divergence? Is it better than normal divergence?
I have created many single divergence indicators on different platforms but they only check the divergence in one of the three terms, short-term, mid-term or long-term. Regular divergence indicator will not exam all three terms at the same time, but Triple Divergence is capable of completing the task.
Sometimes there are too many divergence appear in a short range for the normal divergence indicator.
Let see these two charts below, the first one is Triple Divergence.

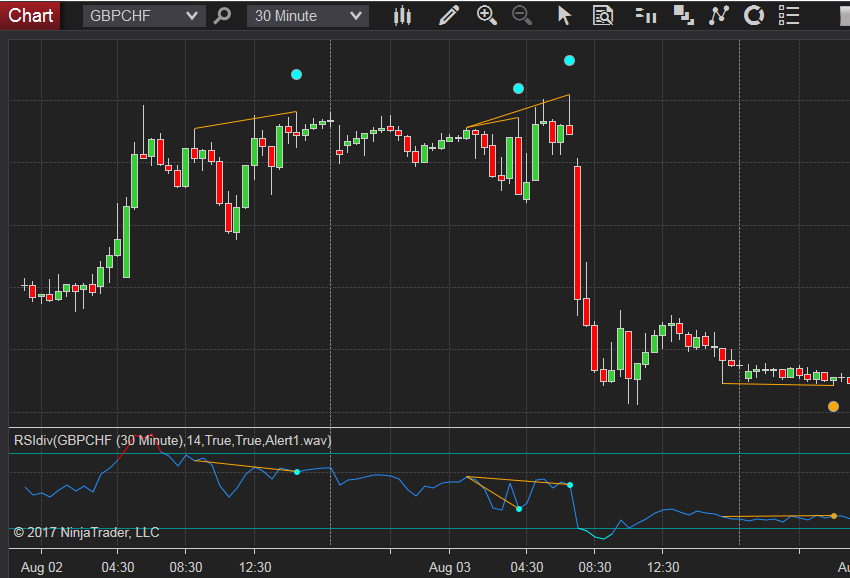
The 2nd one is normal divergence which has more signals.
More signals is not necessary a bad thing, but a signal (Triple Divergence) is confirmed via short, mid and long terms could be more solid.
It doesn’t necessarily mean the Triple Divergence is definitely better than the normal version, they detect signals from different angles.
Features:
- Instant signal on current(last) bar, no repaint.
- Alert when a signal appear.
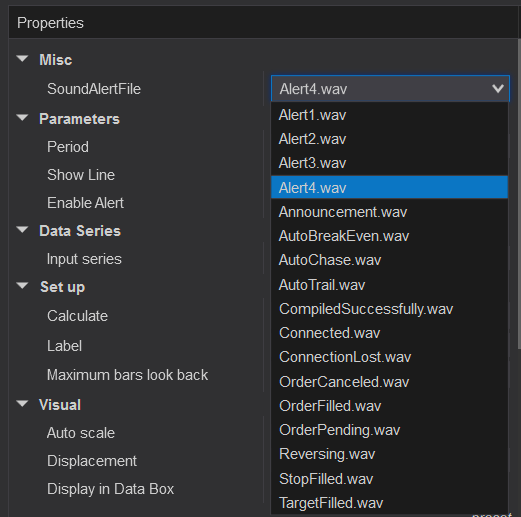
- Select different sound alert files.
- Enable to show lines between Highs and Lows.
- Please note: it doesn’t work in Renko chart.
You can add new sound files to your NT8\sounds directory.

The following video shows how it plots in realtime.
Just updated the new feature “Enhanced mode”.


More screenshots.


It also comes with a Market Analyzer which makes it possible to track signals within any timeframe. The input “Range” is used to check if there was a signal within the given number of bars.


How much is this indicator and where can I access it?
https://www.patternsmart.com/cart/index.php?route=product/product&product_id=387&search=NinjaTrader+8+RSI+Triple+
Hello, is there an option to have just one divergence instead of requiring 3?
Can I get a price on your NinjaTrader 8 RSI triple divergence indicator and market analyzer please
Triple divergence cost.?
Please check https://www.patternsmart.com/cart/index.php?route=product/product&product_id=387&search=RSI
Great job