The Upside Gap Two Crows is a rare, three-candle bearish reversal pattern that flashes at the peak of an aggressive uptrend. While standard two-candle patterns like the Bearish Engulfing are common, this specific setup provides a more nuanced, psychological look at a bull market losing its grip.
Here is a deep technical breakdown of the pattern, its structural anatomy, underlying psychology, and trade execution strategies.
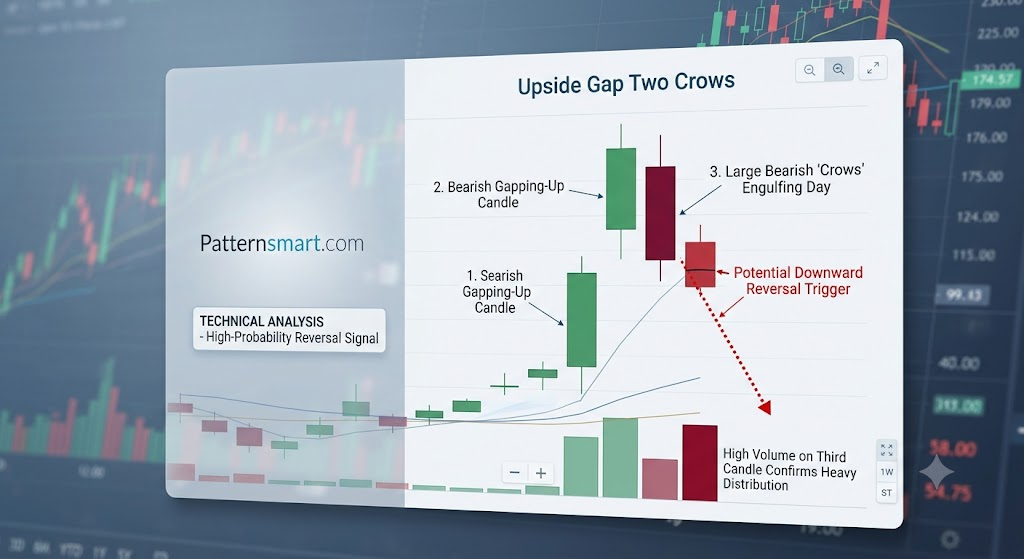
Anatomy of the Pattern
To classify a formation strictly as an Upside Gap Two Crows, it must meet three precise criteria across three consecutive sessions:
- Candle 1 (The Trend Driver): A strong, long green (or white) bullish candle that extends the existing uptrend.
- Candle 2 (The Disappointment): A smaller bearish candle that gaps up above the close of Candle 1. The real body must remain entirely above the real body of the first candle, leaving an open window (gap) between their bodies.
- Candle 3 (The Engulfing Crow): Another bearish candle that gaps open higher than the open of Candle 2, but fails to sustain the move. Sellers aggressively push the price down, forcing Candle 3 to close below the close of Candle 2. Crucially, its body engulfs Candle 2, but its close remains above the close of Candle 1, meaning the initial gap created on day two is not fully closed.
Market Psychology: What the “Crows” Mean
The pattern tells a clear story of exhaustion, failed momentum, and a sudden shift in control.
- Day 1: The bulls are firmly in control. Momentum is strong, pushing prices to new highs within the established trend.
- Day 2: Optimism peaks. The market gaps open higher, showcasing extreme bullish sentiment. However, the buying pressure dries up immediately. Instead of closing near the highs, the session closes lower than its open, forming a small red body. It is a warning sign, but because the price stays above Day 1’s close, the bulls still feel safe.
- Day 3: The bulls try one last time to rescue the trend, forcing an even higher open than Day 2. This attempt is met with heavy institutional selling. Sellers drive the price completely through Day 2’s range. The fact that the market closed lower two days in a row—despite opening higher both times—indicates that demand at these elevated levels has completely evaporated.
The “Two Crows” visually represent the two bearish sessions hanging ominously above the strong bullish candle, signaling an impending drop.
Technical Differences: Two Crows vs. Evening Star
It is easy to mistake this pattern for other bearish setups, specifically the Evening Star or a basic Three Black Crows.
| Aspect | Upside Gap Two Crows | Evening Star | Three Black Crows |
| Candle Count | 3 | 3 | 3 |
| Gapping Structure | Candle 2 and 3 both open above Candle 1’s close. | Only Candle 2 gaps away from Candle 1 and 3. | No upward gaps; three consecutive falling candles. |
| Day 3 Finish | Closes above Candle 1’s close (gap remains partially open). | Closes deep inside or below Candle 1’s real body. | Each candle opens within the previous body and closes lower. |
Trading Strategy and Execution
Because this pattern does not completely close the initial gap on Day 3, technical traders treat it as a highly probable setup that requires confirmation before entry.
                  [Stop Loss] -> Clear above Candle 3 High
                      ▲
                      │
   Candle 2  [█]     [█] Candle 3
              │       █
     ┌────────┘       █
     │                ▼
   [███] Candle 1    [Sell Entry] -> Confirmation Candle Close
     █
     █
1. The Entry Rule
Do not short immediately at the close of Candle 3. Because the gap above Candle 1 is still technically holding, a confirmation candle (Candles 4) is required.
- Execution: Enter a short position when a subsequent candle breaks and closes below the real body of Candle 1. This final break confirms that the gap has filled and the bearish reversal has officially triggered.
2. Risk Management (Stop Loss)
The structural validity of the pattern relies on the highs established during the struggle on Days 2 and 3.
- Placement: Place your stop loss slightly above the highest wick of either Candle 2 or Candle 3 (typically Candle 3). If price moves back above this level, the bearish thesis is invalidated, and the uptrend is likely resuming.
3. Volume Verification
To maximize the reliability of the Upside Gap Two Crows, analyze the underlying volume layout:
- Volume on Candle 1 should be healthy, indicating a standard trend move.
- Volume should noticeably spike on Candle 3. High volume on an engulfing bearish day reveals that large players are aggressively distributing (selling) shares, validating the reversal structure.
Please check our Bearish and Bullish Patterns Indicator collection.
ere is the complete, production-ready Pine Script v5 indicator code to automatically scan for, identify, and plot the Upside Gap Two Crows candlestick pattern on your TradingView charts.
This script strictly enforces all three structural rules of the pattern, includes an optional volume filter to increase accuracy, and plots clear visual labels above the triggering candles.
Pine Script
//@version=5
indicator("Upside Gap Two Crows Detector", overlay=true, max_labels_count=500)

// --- Inputs ---
useVolumeFilter = input.bool(true, title="Confirm with Volume Spike?", tooltip="Requires the 3rd candle to have higher volume than the 2nd candle, confirming institutional distribution.")
srcVolumeMaLength = input.int(20, title="Volume MA Length", minval=1)

// --- Definitions of Current and Past Candles ---
// Candle 1 (Two bars ago)
c1_open  = open[2]
c1_close = close[2]
c1_high  = high[2]
c1_low   = low[2]
c1_isBull = c1_close > c1_open
c1_bodyMax = math.max(c1_open, c1_close)

// Candle 2 (One bar ago)
c2_open  = open[1]
c2_close = close[1]
c2_high  = high[1]
c2_low   = low[1]
c2_isBear = c2_close < c2_open
c2_bodyMin = math.min(c2_open, c2_close)
c2_bodyMax = math.max(c2_open, c2_close)

// Candle 3 (Current bar)
c3_open  = open
c3_close = close
c3_high  = high
c3_low   = low
c3_isBear = c3_close < c3_open
c3_bodyMin = math.min(c3_open, c3_close)
c3_bodyMax = math.max(c3_open, c3_close)

// --- Trend Filter ---
// The pattern must appear at the top of an uptrend. We use a 20-period EMA as a basic trend proxy.
emaTrend = ta.ema(close, 20)
isUptrend = c1_close > emaTrend[2] and c1_open > emaTrend[2]

// --- Structural Conditions ---
// 1. Candle 1 must be a strong bullish candle
condition1 = c1_isBull

// 2. Candle 2 must be bearish, and its body must gap completely above Candle 1's body
condition2 = c2_isBear and (c2_bodyMin > c1_bodyMax)

// 3. Candle 3 must be bearish, open higher than Candle 2's open, and completely engulf Candle 2's body
condition3 = c3_isBear and (c3_open > c2_open) and (c3_bodyMin < c2_bodyMin) and (c3_bodyMax > c2_bodyMax)

// 4. Candle 3 must close strictly ABOVE Candle 1's close (preserving the initial upside gap)
condition4 = c3_close > c1_bodyMax

// --- Volume Filter ---
avgVolume = ta.sma(volume, srcVolumeMaLength)
volumeCondition = not useVolumeFilter or (volume > volume[1] and volume > avgVolume[2])

// --- Final Pattern Logic ---
isUpsideGapTwoCrows = isUptrend and condition1 and condition2 and condition3 and condition4 and volumeCondition

// --- Plotting Signals & Visual Alerts ---
if isUpsideGapTwoCrows
    // Highlight the pattern bars with a subtle background shade
    bgcolor(color.new(color.red, 90), offset=-2, title="Pattern Start")
    bgcolor(color.new(color.red, 90), offset=-1, title="Pattern Middle")
    bgcolor(color.new(color.red, 85), offset=0, title="Pattern Trigger")

    // Draw a prominent label above the 3rd candle
    label.new(
         x=bar_index,
         y=high,
         text="Upside Gap\nTwo Crows",
         color=color.red,
         textcolor=color.white,
         style=label.style_label_down,
         size=size.small
         )

// --- Simple Alert System ---
alertcondition(isUpsideGapTwoCrows, title="Upside Gap Two Crows Detected", message="An Upside Gap Two Crows pattern has formed on {{ticker}}. Watch for a break below the first candle's real body for short entry confirmation.")
Key Technical Implementations in this Script:
- Body Separation Logic: The script uses
math.maxandmath.minto strictly isolate candle real bodies rather than total wicks, ensuring the gap parameters precisely match textbook technical theory. - The Volume Filter Toggle: By default, it requires the third candle (the large “crow”) to see an uptick in volume compared to the second candle. You can turn this off in the settings if you prefer purely structural price action.
- Background Shading: The script applies a multi-bar background highlight, flashing a warning across all three days of the pattern so it is visually unmistakable on your layout.