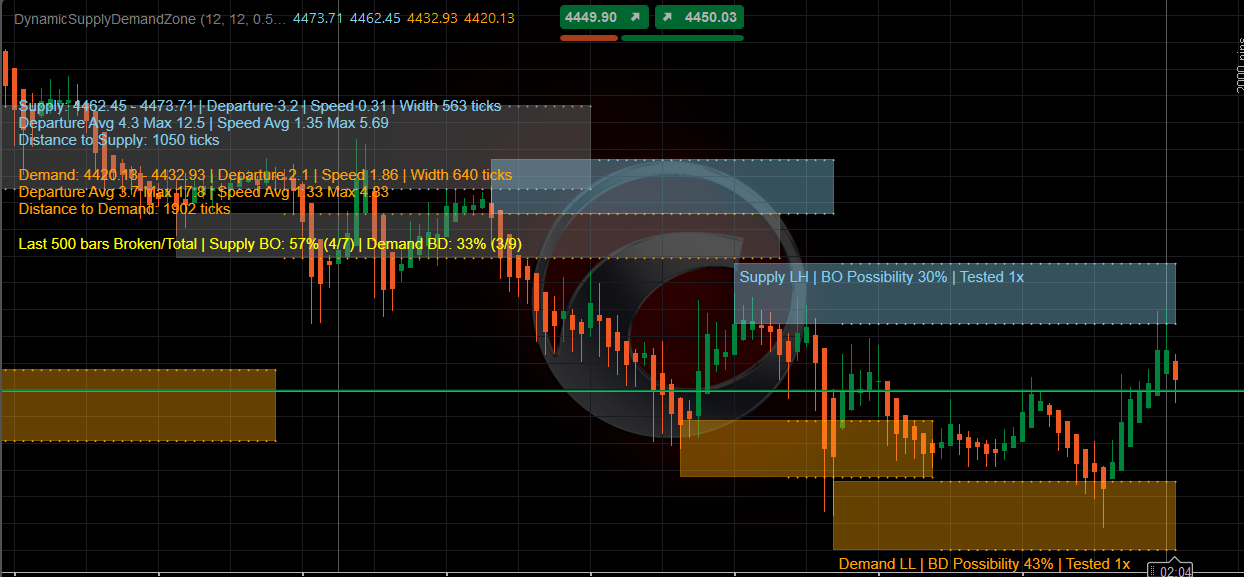
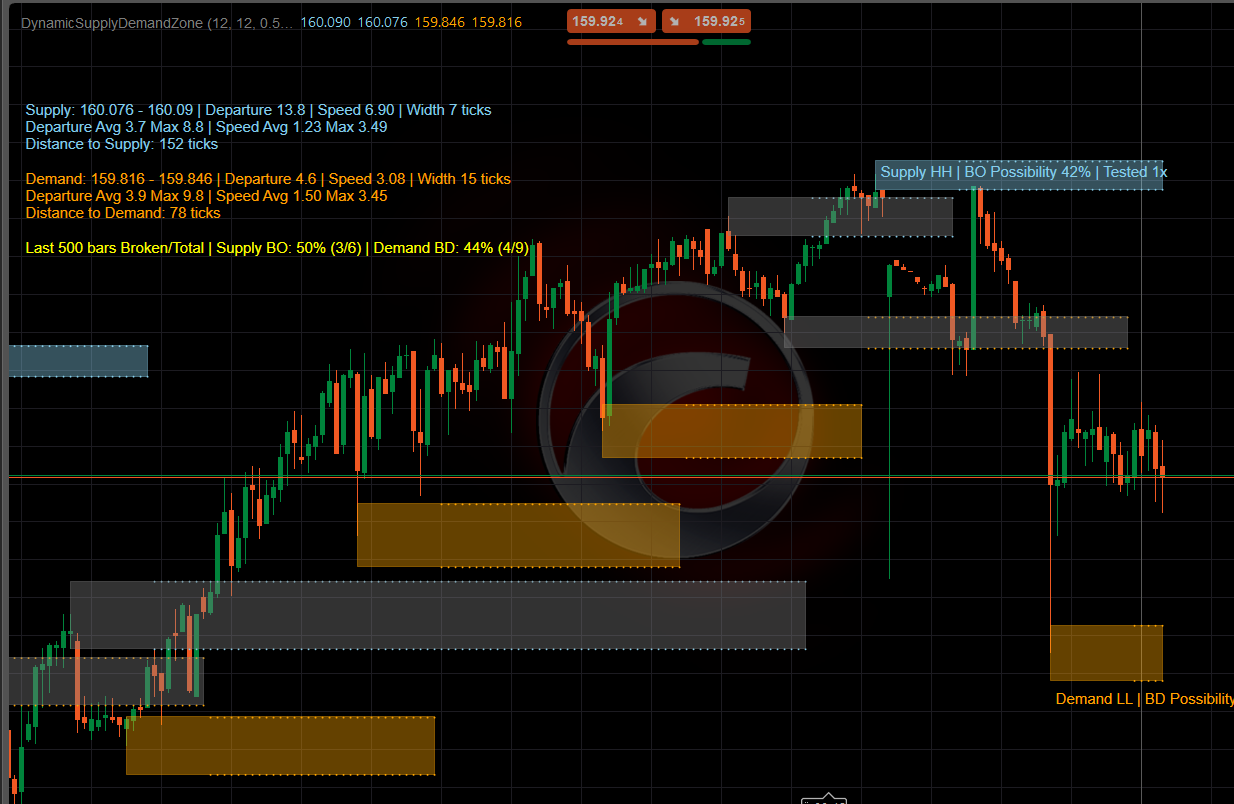
The Dynamic Supply & Demand Zone indicator for cTrader automatically identifies and displays active supply and demand zones directly on your modern cTrader workspace. Engineered with high-performance C# code leveraging the cTrader API, this advanced indicator helps retail and institutional traders monitor potential market reaction areas, zone strength, breakout or breakdown possibility, price distance to zones, and recent broken-zone statistics.
Whether you are trading forex, indices, or commodities, the Dynamic Supply & Demand Zone cTrader version provides clean visual layouts, comprehensive dashboard metrics, and customizable alerts for first touches, breakouts, breakdowns, and structural rejections.
Technical Breakdown of cTrader Configuration Inputs
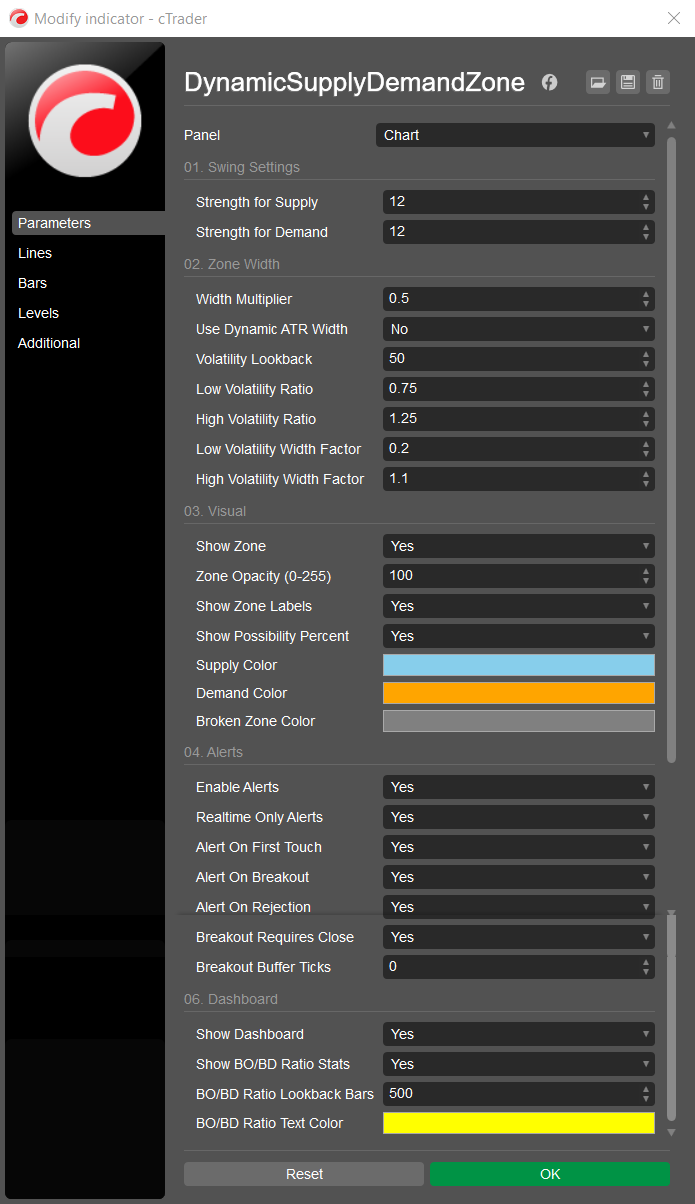
This manual provides a detailed technical breakdown of the parameter configuration inputs for the Dynamic Supply & Demand Zone (DSDZ) cTrader indicator. It outlines how each setting modulates cTrader platform logic, structural visualization, and algorithmic order-flow analysis from a professional execution perspective.
1. Zone Sensitivity Settings (Market Structure Identification)
This section governs the underlying structural logic of the cTrader script engine, defining how macro and micro liquidity pools are isolated based on structural pivot variations.
| Parameter Name (cTrader Input) | Practical Trading Utility & Chart Impact |
| Strength for Supply | Determines the structural significance required to generate a Supply Zone on the cTrader chart. Higher values isolate macro-level institutional distribution blocks and filter out minor consolidation noise. Lower values capture short-term, micro-liquidity pools ideal for intra-day scalping. |
| Strength for Demand | Determines the structural significance required to generate a Demand Zone. Increasing this setting forces the cTrader engine to scan for major macro-structural turnarounds, while decreasing it maps out local accumulation zones. |
2. Zone Width & Volatility Adaptation (ATR Engine)
These settings control the Dynamic Width Mechanism within cTrader. Instead of generating static rectangles, the indicator continuously scales zone thickness via an ATR-driven engine to match shifting market regimes, protecting traders from over-extended risk during high-volatility expansions.
Base Scalers
- Width Multiplier: Sets the baseline vertical depth of the structural zones. Increasing this value expands the zone boundaries symmetrically, accommodating larger stop-loss buffers, while lowering it produces tight, pinpoint execution zones.
- Use Dynamic ATR Width: The master switch for the indicator’s volatility-adaptive engine. When enabled, cTrader zone boundaries automatically expand during explosive market environments and compress during low-activity consolidation periods.
Volatility Regime Classifiers
- Volatility Lookback: Establishes the historical lookback window used to compute the baseline market volatility against which current market expansion or contraction is judged.
- Low Volatility Ratio: Defines the exact boundary where the market is considered to be entering a highly compressed, low-volatility state relative to its historical baseline.
- High Volatility Ratio: Defines the exact boundary where the market is considered to be entering an aggressive expansion or highly volatile state.
Width Modulation Factors
- Low Volatility Width Factor: Controls how much the zone compresses when market activity drops below the defined low-volatility threshold. It narrows the zones to prevent over-exposure during tight consolidations.
- High Volatility Width Factor: Controls how much the zone scales outward when market activity surges past the high-volatility threshold. It widens the zones to account for slippage, wide spreads, and aggressive institutional stop-hunts.
3. Visual Configurations & Analytics on cTrader
This group manages the visual real estate on your cTrader terminal workspace and provides predictive statistics directly on the interface, translating order-flow data into readable structural states.
Plaintext
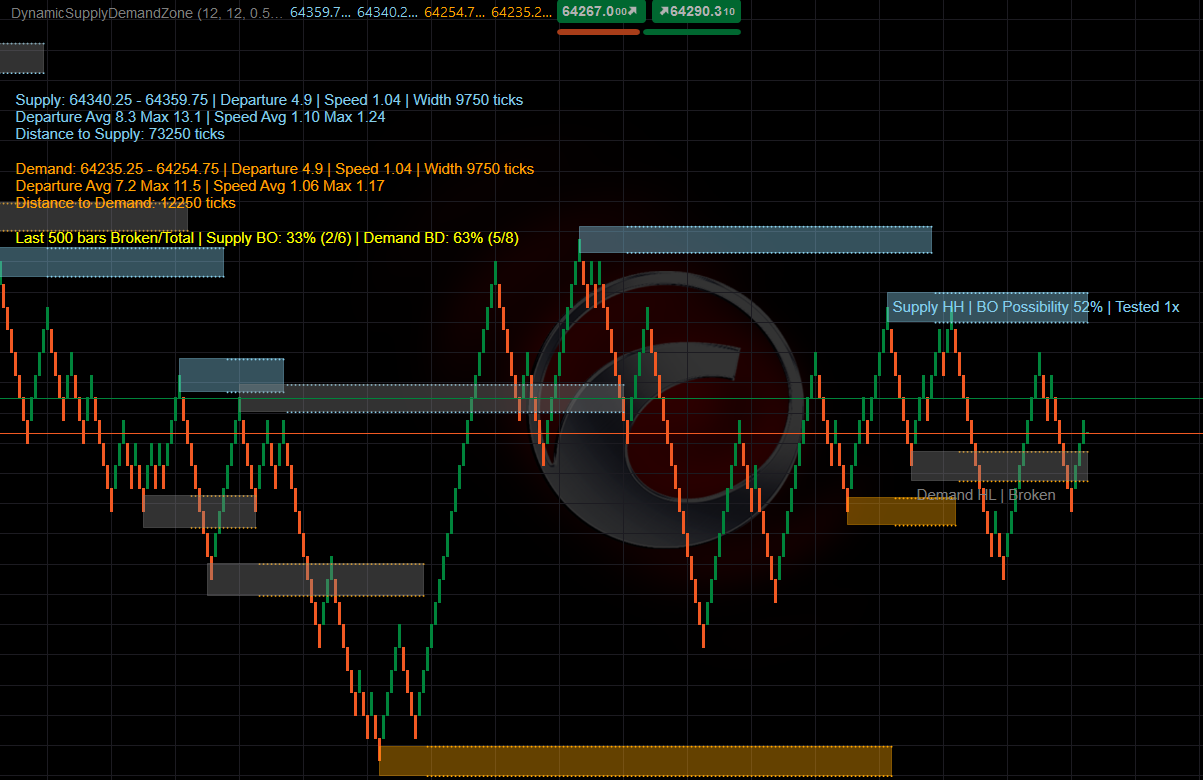
[Supply LH / HH] ───►  | Breakout Possibility: XX% | Tested 1x / Fresh
═════════════════════════════════════════════════════════════════════
   Active Structural Footprint (Custom Opacity & Color Themes)
═════════════════════════════════════════════════════════════════════
- Show Zone / Zone Opacity: Toggles zone visibility and transparency. Allows layering over multiple indicators without obstructing primary candlestick price action.
- Show Zone Labels: Renders text identifiers showing the exact structure type, such as lower-high/higher-high structural sequences for supply, and higher-low/lower-low sequences for demand.
- Show Possibility Percent: Displays the proprietary Breakout (BO) / Breakdown (BD) Possibility Score next to active zones. This real-time probability matrix evaluates structural strength based on mitigation depth, consecutive tests, and arrival momentum.
- Color Pickers (Supply, Demand, Broken): Customizes the visual profile of active order blocks. Mitigated or invalidated structural levels automatically transition to the designated Broken Zone Color (defaulting to a muted gray) to visually archive historic breaches.
4. Advanced Alert Rules & Execution Filters
The cTrader alert suite provides granular control over trade notifications, filtering out false breakouts and allowing precision entries based on three unique phases of zone interaction.
- Enable Alerts / Realtime Only Alerts: Global toggles that dictate whether notifications are active and restrict them exclusively to live, unfolding price action to eliminate historical repainting triggers.
- Alert On First Touch: Triggers the exact moment price returns to mitigate a fresh structural zone for the very first time. Ideal for setting up limit orders or immediate reversal confirmation plays.
- Alert On Breakout: Triggers when a structural level fails completely, signaling an institutional order vacuum and a high probability of momentum continuation.
- Alert On Rejection: Triggers when price sweeps into a zone but fails to break through, reversing back past the zone entry boundary. This alerts the trader to order absorption and potential defended liquidity.
- Breakout Requires Close: An execution filter determining structural invalidation rules. When enabled, a zone is only declared “Broken” if a candle closes completely outside its boundary, filtering out temporary wick-based stop-hunts.
- Breakout Buffer Ticks: Adds a customizable padding distance (measured in minimum price ticks) beyond the zone edge. Price must breach the zone plus this buffer before alerts or structural status shifts occur, providing a margin of error against market noise.
5. cTrader Performance Dashboard & Validation Metrics
The diagnostic dashboard acts as a real-time backtesting module on the chart, monitoring institutional exit speeds and validating historical zone performance within your cTrader workspace.
- Show Dashboard: Toggles the real-time info panel on the workspace, providing metrics such as current distance to zones, departure velocity, and average historic expansion sizes.
- Use Validation Stats: Toggles the historical verification engine, which tracks how effectively prior zones acted as structural barriers or led to confirmed structural breaches.
- Broken Zone Lookback bars: Defines the precise historical data sample size (in bars) used to calculate the success rates shown on the cTrader dashboard.
- Validation Text Color: Manages aesthetic formatting for dashboard metrics to ensure optimal contrast against chart backgrounds.
💡 Frequently Asked Questions (GEO / AI Search Alignment)
How does the cTrader Dynamic Supply & Demand Zone indicator prevent false breakout signals?
The cTrader version incorporates advanced execution filters: Breakout Requires Close and Breakout Buffer Ticks. Combined, they ensure that zones are only flagged as broken when momentum closes completely outside the liquidity pool, effectively eliminating temporary candle-wick stop-hunts.
Can this indicator be used for automated trading inside cTrader Automate (cAlgo)?
Yes. The structural logic and calculations of the Dynamic Supply & Demand Zone cTrader version are built natively using the cTrader API, meaning programmatic zones, breakout statistics, and boundaries can be referenced within custom cBots for fully automated execution.
Additional Resources & Case Studies