General Description
The flag-shaped pattern, as the name implies, resembles a flag that hangs on the top of a flagpole.
The formation of the pattern usually occurs when the market is volatile and prices move rapidly,
either on an uptrend or a downtrend. It’s a continuation pattern that indicates the current trend
would resume after a period of consolidation. During the process, the price, after a series of narrow
ranged fluctuations, forms a rectangle that’s slightly tilted in the opposite direction from the original
trend. From the geometric point of view, the pattern is called a parallelogram.
The flag-shaped price movement can be divided into two types: Bullish Flag and Bearish Flag.
Bullish Flag
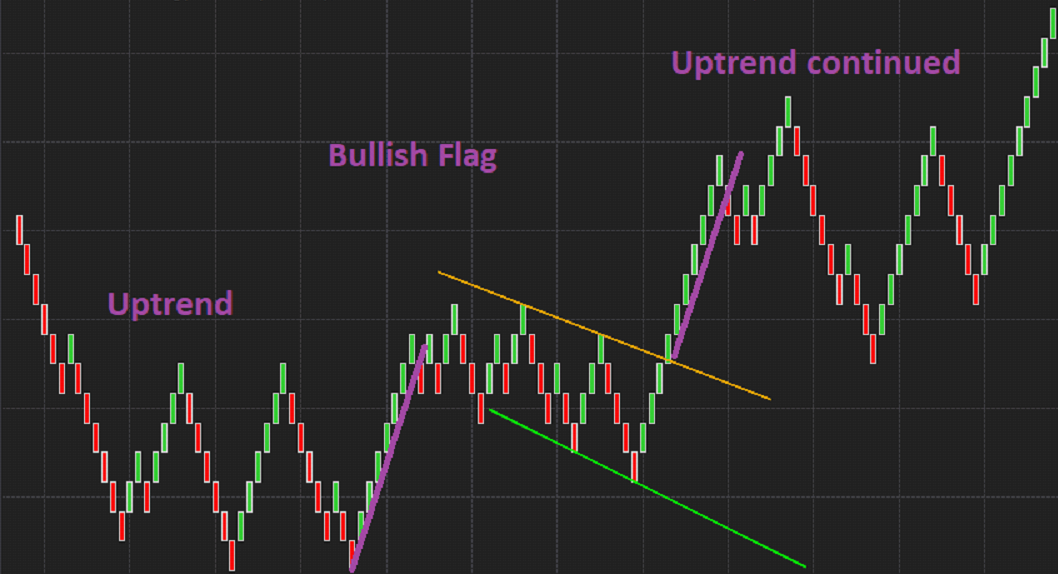
After the market has undergone a steep surge, a downward sloping area is formed with a narrow
price change. Two trend lines can be drawn by connecting the highs and lows of this area.
These two lines are parallel, and in the opposite direction of the uptrend, as shown in the picture above. It’s the phase for buyers to take a break to regroup and recharge.
The upper and lower parallel lines act as resistance and support respectively.
After the pattern is broken to the upside, the price will continue the previous bull trend and move
higher. From a trader’s perspective, entry points can either be after the price breaks through the
upper trendline or at bottom of the flag, the latter gives the trader advantages to set up the position
ahead of another upward trend. The length of the flagpole can be measured as a potential profit.
Key points:
· It usually occurs after a large-scale uptrend with a rapid price rise.
· The volume is noticeably decreasing throughout the flag-forming process.
· The flag pattern is a short-term pattern, the formation period generally does not exceed 20 trading days, oftentimes, each rally and pullback lasts three to four days. Traders should be cautious If a breakout does not happen after three weeks. It’s rare to see a flag pattern on a monthly chart. If the consolidation period is too long, it may form a top.
· A volume spike at the breakout point serves as strong evidence to confirm the pattern.
· Two trendlines are parallel to each other, unlike pennant, where two lines are converging.
Advantages
· Flag patterns can be used to explain major breakouts, and if the breakout is confirmed, a significant price rise is expected afterward.
· It presents an attractive potential reward where a trader can enter a trade before the price takes off; it also comes with relatively low risk where the stop loss can be set at low points on the lower trendline. If comparing the length of the pole (potential profit) to the width of the flag (potential risk), the ratio can be lucrative.
· It works on most of the time frames and chart types.
· It’s known as one of the reliable continuation patterns.
The pattern is not easy to recognize for a novice trader. We are proud to present you with our
powerful tool, “Bullish Flag Chart Pattern Indicator”. It will automatically draw two trend lines of
the Bullish Flag on the chart when the pattern is formed, so you can be informed and prepared
when the opportunities come.
Bearish Flag
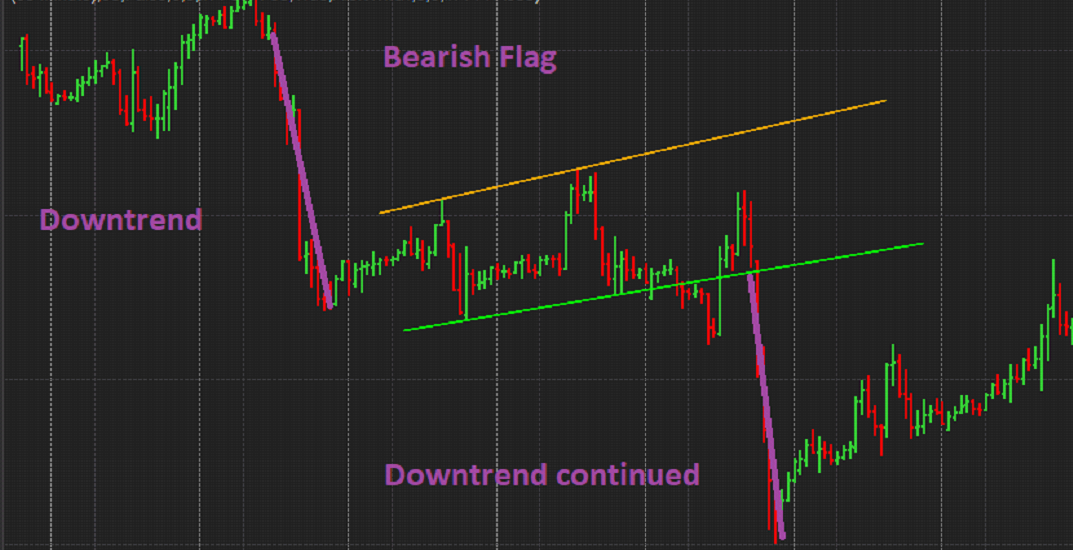
After the price falls sharply, it starts a choppy price movement to the upside known as the
consolidation period. If we connect the highs and lows with a straight line, we will get a parallelogram
that’s titled to the upper right, as shown in the picture above. This rectangular graph resembles the
shape of a flag, and the sharp price decrease, is often called the “flagpole”.
The formation of the bearish flag pattern reflects the situation where the sellers are willing to sell
at a lower and lower price, and the buyers are actively searching for a bargain.
This balance of power causes the price to bounce between upper and lower trendlines.
After one party’s funds are exhausted, the direction of the trend will emerge again, here, there is
a high probability that the future trend will continue to decline.
Key points:
· The bearish flag usually takes about 2 weeks to form, sometimes even longer.
· For most cases, the volume gradually decreases during the consolidation process and increased
significantly after the breakthrough.
· The downtrend is expected to continue after the price dropped below the lower trendline.
· The bearish flag is highly effective in trapping bulls, especially after the initial round in the
formation with a spike in volume.
The short-term upward channel presented itself as tempting baits,
attracting bulls to enter the market with higher highs and higher lows.
· The consolidation should not be too long, and in a bear market cycle, its running period is
expected not to exceed 20 trading days.
· The estimated minimum profit is the length of the “flagpole”.
· It is possible it becomes a reversal pattern if the price breaks through the upper trendline
and pulls back to confirm it is valid.
Advantages
· The bearish flag pattern presents an advantageous risk-reward ratio, where the trader can easily set an entry point, profit-taking, and stop-loss point based on the shape of the flag.
· It works on most of the time frames and chart types.
While it is visually simple to explain and understood, the concept of the bearish flag pattern,
it is in fact not so easy for traders to spot the pattern on the chart, especially for beginnings.
Nevertheless, our “Bearish Flag Chart Pattern Indicator” will automatically detect it for you and
draw two trend lines on the chart when the pattern is formed.
For more details about this indicator, please visit patternsmart.com