Demystifying Multi-Timeframe (MTF) Indicators: How They Work and Why Traders Use Them
In technical analysis, context is everything. A trading setup that looks bullish on a 5-minute chart might actually be occurring right underneath a massive overhead resistance level on a 60-minute chart. Traditionally, traders have had to juggle multiple chart windows side-by-side to monitor higher timeframe trends while executing trades on lower timeframes.
Multi-Timeframe (MTF) indicators solve this problem by bringing higher timeframe data directly onto your primary execution chart. This article explores what MTF indicators are, how they work under the hood, and practical examples using both trend-following and momentum indicators.
1. What is a Multi-Timeframe (MTF) Indicator?
A Multi-Timeframe indicator calculates technical values (such as Moving Averages, RSI, MACD, or CCI) based on a timeframe higher than the chart you are currently viewing, but plots them directly onto your lower timeframe workspace.
Instead of switching back and forth between charts or splitting your screen into four different monitors, an MTF indicator overlays the macro perspective directly onto your micro execution timeframe. This allows you to trade with the dominant trend while retaining granular precision for your entry and exit points.
2. How MTF Indicators Work: The “Step-Like” Visual Signature
When you look at an MTF indicator on a lower timeframe chart, you will immediately notice a distinct step or staircase pattern rather than a smooth curve.
This happens because a higher timeframe candle encompasses multiple lower timeframe candles. For example:
- One 30-minute candle equals six 5-minute candles.
- One 60-minute candle equals six 10-minute candles.
During the formation of those six lower timeframe candles, the price data for the higher timeframe candle is still evolving, but its final indicator value for that period is locked only when the higher timeframe bar closes or updates. Consequently, the MTF indicator line remains flat (horizontal) across the lower timeframe bars and then “steps” up or down when the higher timeframe bar updates.
3. Case Study 1: Multi-Timeframe EMA (Exponential Moving Average)
Let’s examine how this works in practice with a trend indicator.
- Chart Setup: A 5-minute chart of the Nasdaq futures contract (
NQ 12-26) shown in Figure 1 and Figure 2. - Indicators Used: A regular 5-minute EMA (blue line) and a higher timeframe 30-minute MTF EMA (orange line).
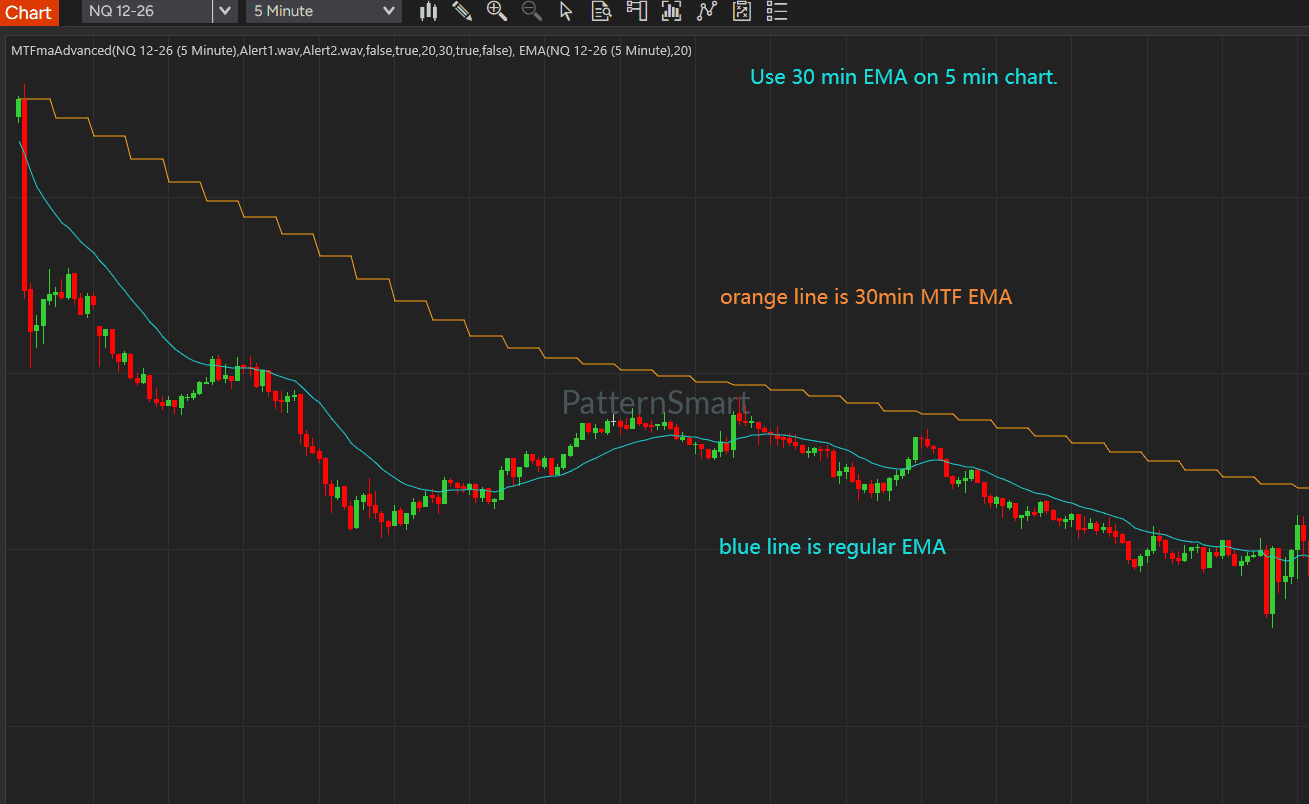
Figure 1: Comparison of a regular 5-minute EMA (blue) versus a 30-minute MTF EMA (orange) on a 5-minute NQ chart.
Observations from the EMA Example:
- The Macro Trend Filter: The orange line represents a 30-minute EMA plotted on a 5-minute chart. Because it relies on 30-minute bars, it reacts much slower to short-term price fluctuations, effectively filtering out market “noise.”
- The Step Pattern: In Figure 2, notice how the orange 30-minute MTF EMA remains completely flat horizontally between points A and B. During this window, multiple 5-minute candles rise and fall, but the underlying 30-minute value has not shifted yet. When the 30-minute period concludes, the line steps down to reflect the updated higher timeframe average.
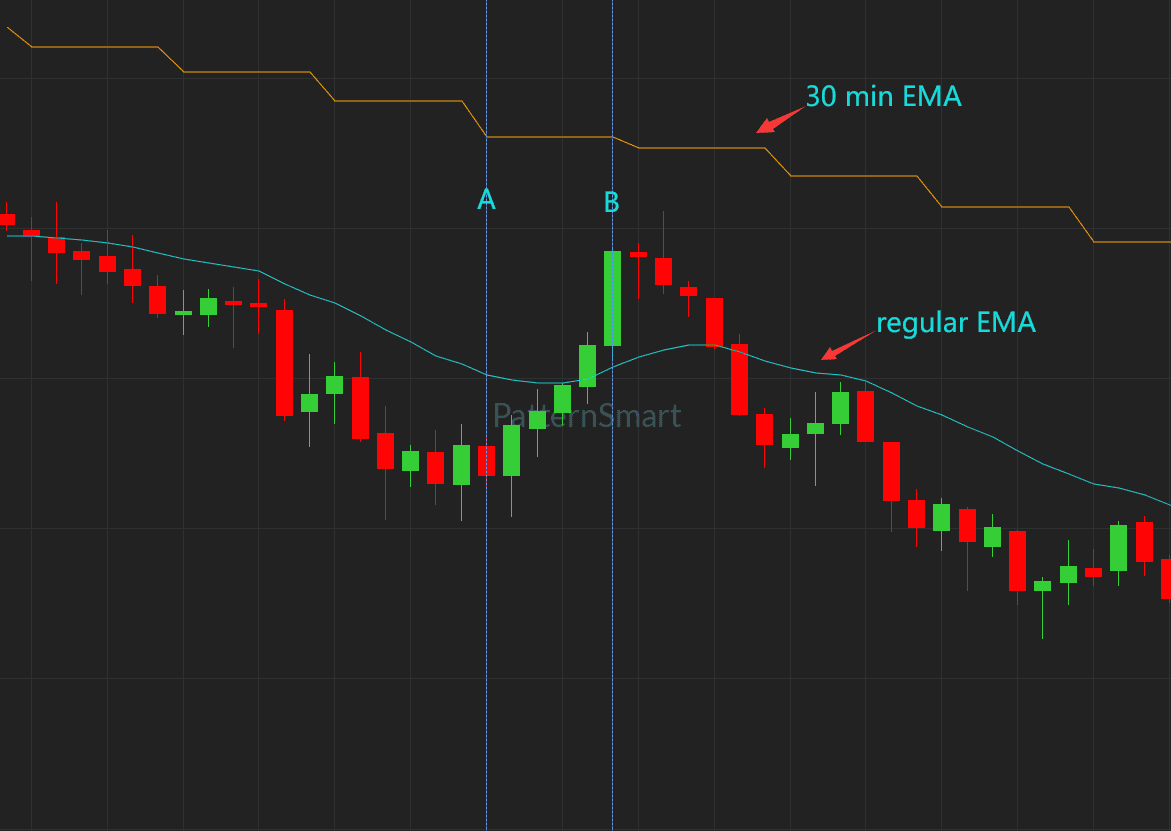
Figure 2: Zoomed-in view highlighting the horizontal steps of the 30-minute MTF EMA between points A and B.
4. Case Study 2: Multi-Timeframe CCI (Commodity Channel Index)
MTF capability isn’t just for moving averages; it is equally powerful when applied to oscillator and momentum indicators like the Commodity Channel Index (CCI).
- Chart Setup: A 10-minute chart of the Invesco QQQ Trust (
QQQ) shown in Figure 3 and Figure 4. - Indicators Used: A regular 10-minute CCI (bottom panel) and a 60-minute MTF CCI (middle panel).
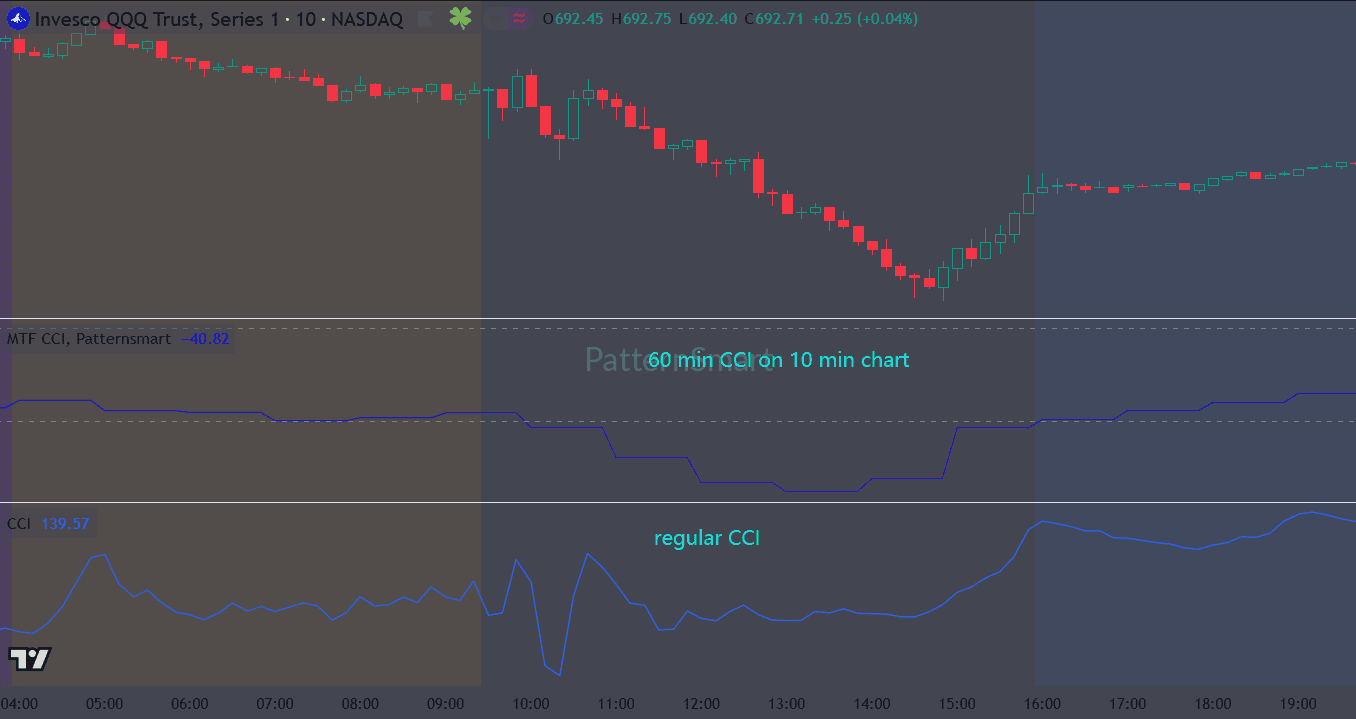
Figure 3: Invesco QQQ 10-minute chart featuring a regular CCI at the bottom and a 60-minute MTF CCI in the middle panel.
Observations from the CCI Example:
- Smoothing Out Noise: The regular 10-minute CCI fluctuates wildly with every minor swing in price.
- Higher Timeframe Momentum: The 60-minute MTF CCI provides a much cleaner, smoothed-out trajectory of institutional momentum.
- Transition Points: In Figure 4, points A and B illustrate how the 60-minute MTF CCI holds steady across several 10-minute bars before stepping down. Traders use this higher timeframe momentum state to decide whether lower timeframe pullbacks are valid trend continuations or dangerous counter-trend traps.
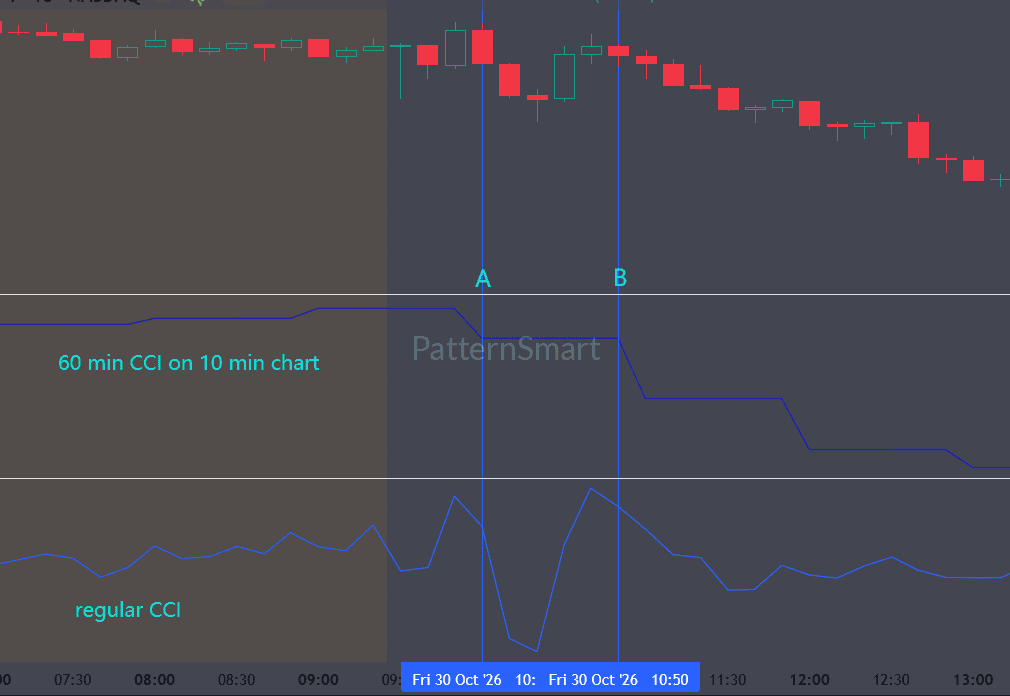
Figure 4: Detailed close-up of the 60-minute MTF CCI step changes relative to lower timeframe price action.
5. Key Benefits of Using MTF Indicators
- Reduced Cognitive Load: You don’t have to constantly calculate or visually cross-reference multiple chart windows. Everything you need is synthesized onto a single screen.
- Improved Trend Alignment: By trading in the direction dictated by the MTF indicator (e.g., only taking short trades when price is below the 30-minute MTF EMA), you significantly increase your probability of success.
- Elimination of Repainting Confusion: Quality MTF indicators reference historical completed bars of the higher timeframe, ensuring that past data remains stable and reliable for backtesting and analysis.
Summary
Multi Time Frame indicators bridge the gap between macro market analysis and micro execution. By projecting higher timeframe moving averages, oscillators, or momentum tools onto lower timeframe charts, traders gain a clearer view of institutional trends while maintaining precise timing for entries and exits.