Drawing trendlines and identifying price consolidation patterns manually across multiple timeframes is time-consuming, subjective, and prone to human error. When fast-moving markets shift, missing a classic wedge formation can mean missing out on explosive breakout trades or holding a position through an unexpected reversal.
The Chart Pattern Wedge for TradingView indicator eliminates subjectivity by delivering fully automated, real-time detection of bullish falling wedges and bearish rising wedges. Built on clean Pine Script v6 execution, this professional trading tool visualizes converging support and resistance trendlines, projects future target zones, and sends instant alert notifications the moment a valid pattern completes on your chart.
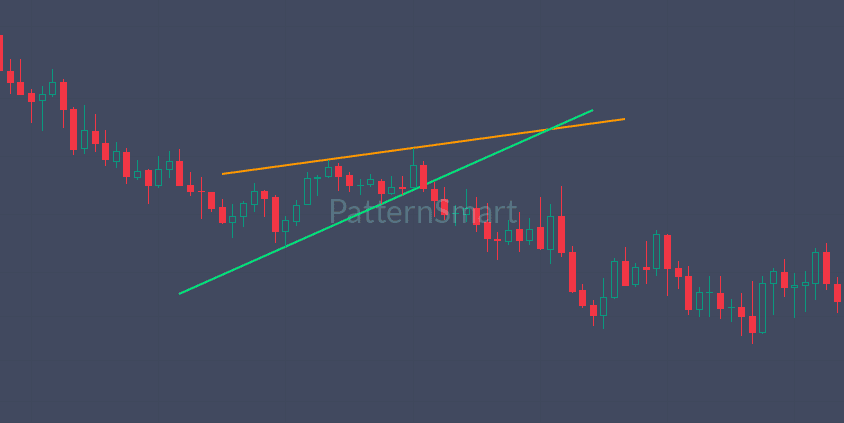
Why Wedge Patterns Give Traders a Structural Edge
Wedge patterns are among the most reliable chart structures in technical analysis. They represent periods of tightening market consolidation where buying and selling pressure compress before an explosive directional move.
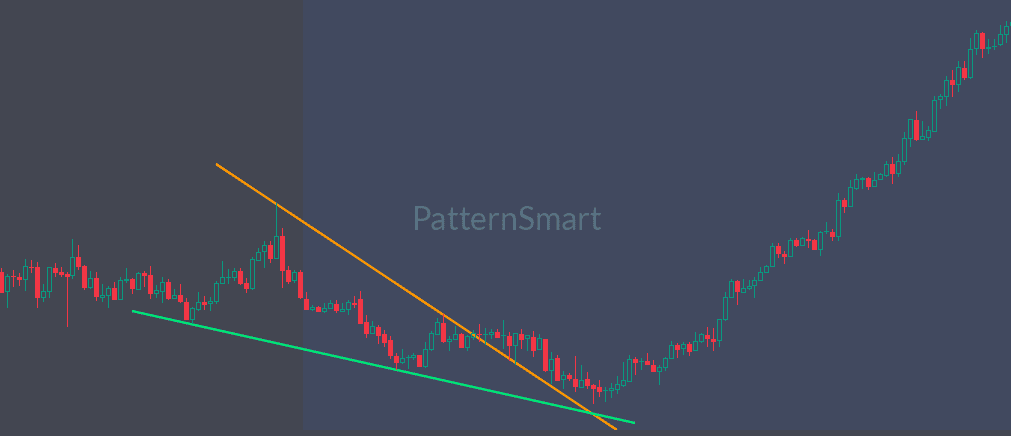
- Falling Wedges (Bullish Reversal & Continuation): Form when price makes lower highs and lower lows within a narrowing channel. The slope of the upper resistance line descends steeper than the lower support line, reflecting diminishing selling pressure. A breakout above resistance signals a powerful bullish impulse.
- Rising Wedges (Bearish Reversal & Continuation): Form when price makes higher highs and higher lows within a contracting channel. The slope of the lower support line ascends steeper than the upper resistance line, showing weakening buying momentum. A breakdown below support signals an impending bearish selloff.
Manually drawing these setups requires constantly scanning charts, plotting multi-point pivots, and calculating line convergence. Automating this process guarantees rule-based consistency, ensuring you only trade high-probability setups across any asset class.
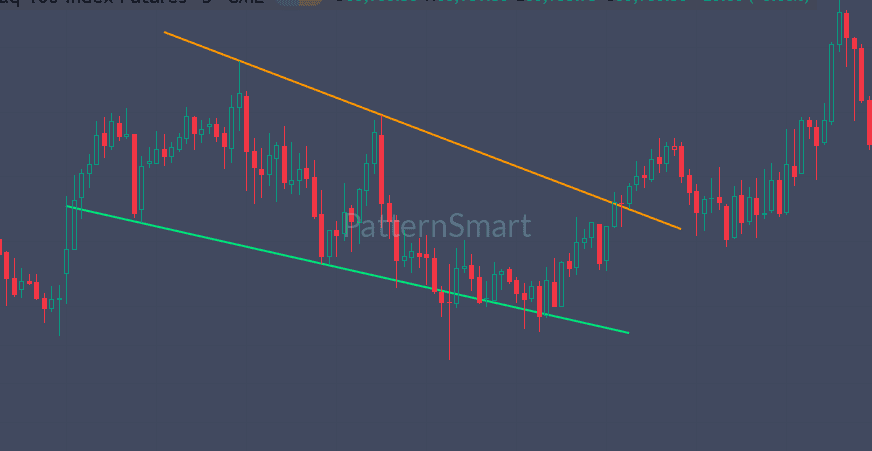
Key Features & Capabilities
+-----------------------------------------------------------------------+
|              CHART PATTERN WEDGE INDICATOR FOR TRADINGVIEW            |
+-----------------------------------------------------------------------+
|  [Falling Wedge Engine]              [Rising Wedge Engine]            |
|  * Bullish Reversal / Continuation    * Bearish Reversal / Continuation|
|  * Slope Convergence Validation      * Multi-Pivot Support Lines      |
+-----------------------------------------------------------------------+
|  [Multi-Horizon Pattern Sizes]                                        |
|  * Small (Micro/Scalp)  |  Medium (Day Trade)  |  Large (Macro/Swing) |
+-----------------------------------------------------------------------+
|  [Visual & Execution Suite]                                           |
|  * Extended Trendlines  |  Show Last Only Mode  |  Instant Alerts     |
+-----------------------------------------------------------------------+
1. Dual Pattern Scanning Engine
Simultaneously scan for both Falling Wedges (Bullish) and Rising Wedges (Bearish) on a single overlay layout. Toggle either pattern type on or off independently to suit your directional bias or trading style.
2. Multi-Horizon Pattern Size Filters
Markets are fractal, meaning wedges occur across varying time horizons simultaneously. The indicator features a triple-tier scale engine:
- Small Patterns: Captures tight intraday coils for scalping and short-term momentum trades.
- Medium Patterns: Scans standard swing structures ideal for hourly and multi-hour chart setups.
- Large Patterns: Identifies major macro consolidations on daily and weekly charts for position trading.
3. Projected Trendline Extensions
The indicator automatically projects upper resistance and lower support lines forward into future bars beyond the pattern’s completion point. This gives you clear visual breakout levels, target zones, and retest boundaries before price arrives.
4. Clean Chart Management Mode
Avoid visual overload from old historical lines. Enable the Show Last Pattern Only feature to automatically erase outdated projections, keeping your charts clean and focused entirely on active market opportunities.
5. Bar-Close Real-Time Alerts
Never miss a breakout setup again. Built-in alert triggers send immediate notifications to your TradingView desktop app, mobile app, email, or custom webhooks the exact moment a valid wedge pattern closes.
Technical Specifications & Customization Controls
The Chart Pattern Wedge for TradingView features an intuitive settings panel that gives you complete command over detection criteria, display styles, and color schemes.
| Setting Category | Control Parameter | Default Value | Description & Functionality |
| Pattern Selector | Show Falling Wedge | Enabled (true) | Toggles real-time detection and rendering of bullish falling wedges. |
| Pattern Selector | Show Rising Wedge | Enabled (true) | Toggles real-time detection and rendering of bearish rising wedges. |
| Pattern Sizes | Enable Small | Enabled (true) | Activates scanning for tight micro-horizon pattern consolidations. |
| Pattern Sizes | Enable Medium | Enabled (true) | Activates scanning for balanced, standard-horizon pattern setups. |
| Pattern Sizes | Enable Large | Enabled (true) | Activates scanning for broad macro-horizon structural pattern setups. |
| Parameters | Show Last Pattern Only | Disabled (false) | When active, removes past patterns to keep the overlay focused on the latest structure. |
| Parameters | Alert Notifications | Enabled (true) | Enables bar-close event triggers for TradingView alert routing. |
| Parameters | Extension Bars | 20 Bars | Specifies how far past the final pivot trendlines project into future price action. |
| Line Style | Line Style | Solid | Customizes line appearance across Solid, Dashed, or Dotted formats. |
| Line Style | Line Width | 2 Pixels | Controls pixel thickness for resistance and support lines. |
| Line Style | Bullish Upper / Lower | Orange / Lime | Fully customizable hex colors for bullish wedge boundary lines. |
| Line Style | Bearish Upper / Lower | Orange / Lime | Fully customizable hex colors for bearish wedge boundary lines. |
Detailed Pattern Size Overview
Understanding how pattern size settings function helps you tailor the indicator to your precise trading workflow.
Pattern Horizon     Pivot Lookback Range     Best Timeframes        Primary Trading Style
-------------------------------------------------------------------------------------------
Small               Micro Lookback           1m, 5m, 15m            Scalping / Intraday
Medium              Standard Lookback        15m, 1h, 4h            Day / Swing Trading
Large               Macro Lookback           4h, 1D, 1W             Position Trading
Micro-Horizon (Small)
Optimized for active traders who operate on lower timeframes (1-minute to 15-minute charts). Micro patterns detect fast-forming, tight consolidations that often trigger swift breakout impulses lasting a few candles. These setups offer tight risk-to-reward parameters for high-frequency execution.
Standard-Horizon (Medium)
Designed for intraday swing traders and day traders working on 15-minute to 4-hour charts. Medium patterns filter out short-term market noise to uncover sustained consolidation phases. Breakouts from medium structures often establish the prevailing trend for the remainder of the session.
Macro-Horizon (Large)
Tailored for swing traders and position traders operating on 4-hour, Daily, or Weekly charts. Large patterns surface major structural inflection points. Identifying a daily falling or rising wedge allows traders to align lower-timeframe entries with major multi-week market reversals.
Proven Trading Strategies using Automated Wedges
To maximize your winning rate, combine the indicator’s trendlines with structured price action execution techniques.
Strategy 1: The Breakout & Retest Method
- Identify Pattern: Allow the indicator to plot a confirmed Falling Wedge (Bullish) or Rising Wedge (Bearish).
- Confirm Breakout: Wait for a full candle body to close outside the extended trendline boundary.
- Execute Retest: Place an entry limit order near the broken trendline as price returns to retest it as new support or resistance.
- Risk Management: Place your stop-loss just inside the opposite trendline boundary and target a 1:2 or 1:3 Risk-to-Reward ratio based on the height of the wedge base.
Strategy 2: Multi-Timeframe Nested Confluence
- Macro Bias: Load a 4-Hour or Daily chart with Enable Large selected to identify macro wedge consolidations.
- Micro Timing: Drop down to a 5-Minute or 15-Minute chart with Enable Small active when price approaches the macro boundary.
- Execution: Take trades when a micro-wedge forms in the same direction as the macro structure (e.g., a small falling wedge forming directly on the support boundary of a large falling wedge).
Trading Note: Combining structural chart pattern detection with volume confirmation or key horizontal support/resistance levels significantly increases setup reliability across volatile market conditions.
Manual Charting vs. Chart Pattern Wedge Indicator
| Execution Capability | Manual Charting | Chart Pattern Wedge Indicator |
| Scanning Speed | Slow, manual checking of individual charts | Instant automated detection across all loaded charts |
| Subjectivity | High; traders often force lines onto bad setups | Zero; objective rule-based mathematical criteria |
| Multi-Scale Coverage | Difficult; requires manual timeframe switching | Simultaneous multi-scale scanning (Small, Medium, Large) |
| Alert Integration | Must draw and configure manual trendline alerts | Automatic bar-close alerts generated on pattern completion |
| Visual Cleanliness | Cluttered with stale lines over time | Auto-cleans historical lines with “Show Last Only” mode |
| Consistency | Affected by emotional fatigue or bias | 100% execution consistency across all market sessions |
Step-by-Step Installation & Configuration Guide
Setting up the indicator on your TradingView account takes less than two minutes:
Step 1: Copy Source Code ──> Step 2: Open TradingView Pine Editor ──> Step 3: Paste & Add to Chart
                                                                              │
Step 6: Start Trading   <── Step 5: Set Up Alerts Notifications <── Step 4: Configure Visual Styles
- Open TradingView: Launch your chart platform on Web, Desktop, or Mobile.
- Access Pine Editor: Click the Pine Editor tab located at the bottom of your workspace.
- Add Script: Paste the script into the editor window, click Save, and then click Add to Chart.
- Customize Visuals: Double-click any generated trendline or click the gear icon next to the indicator name in the top legend to adjust line styles, colors, and pattern scales.
- Configure Real-Time Alerts:
- Click the Alerts icon (bell icon) in the right-side panel.
- Set Condition to
ChartPatternWedges. - Select your preferred trigger mode (
Once Per Bar Close). - Choose your delivery method: In-App Popups, Mobile Push Notifications, Email, or Webhooks.
Frequently Asked Questions
Does this indicator repaint historical patterns?
No. The detection engine evaluates pivot structures on confirmed bar closes. Once a bar closes and a pattern is confirmed and plotted, it will not shift, recalculate, or disappear from historical price action.
Which financial markets and timeframes are supported?
The indicator is completely asset-agnostic. It performs seamlessly across Crypto, Forex, Stocks, Indices, Commodities, and Futures. It functions effectively on all timeframes supported by TradingView, from 1-minute charts up to Monthly charts.
How does the “Extension Bars” feature help my trading?
The Extension Bars parameter projects the calculated resistance and support lines past the final pivot point into future empty chart space. This provides clear prospective visual levels where price is likely to find support, encounter resistance, or trigger a breakout.
Can I run alerts on multiple instruments simultaneously?
Yes. You can attach TradingView alerts to multiple charts and timeframes where the indicator is applied. When a Rising or Falling Wedge completes on any monitored chart, TradingView instantly delivers the alert notification directly to your device.
How do I maintain a clean workspace while scanning historical data?
To keep your charts clean, open the indicator settings and check the Show Last Pattern Only option. This keeps only the most recent active structure visible on your chart while automatically removing older historical setups.